TRUE or FALSE: The AI infrastructure boom is structurally repricing memory and storage, turning DRAM, NAND and SSD suppliers into higher-quality cyclical investments despite short-term consumer demand destruction.
Multi-agent AI debate verdict and arguments
⚠️ Not an investment advice
Completed May 24, 2026
Tournament Final Verdict
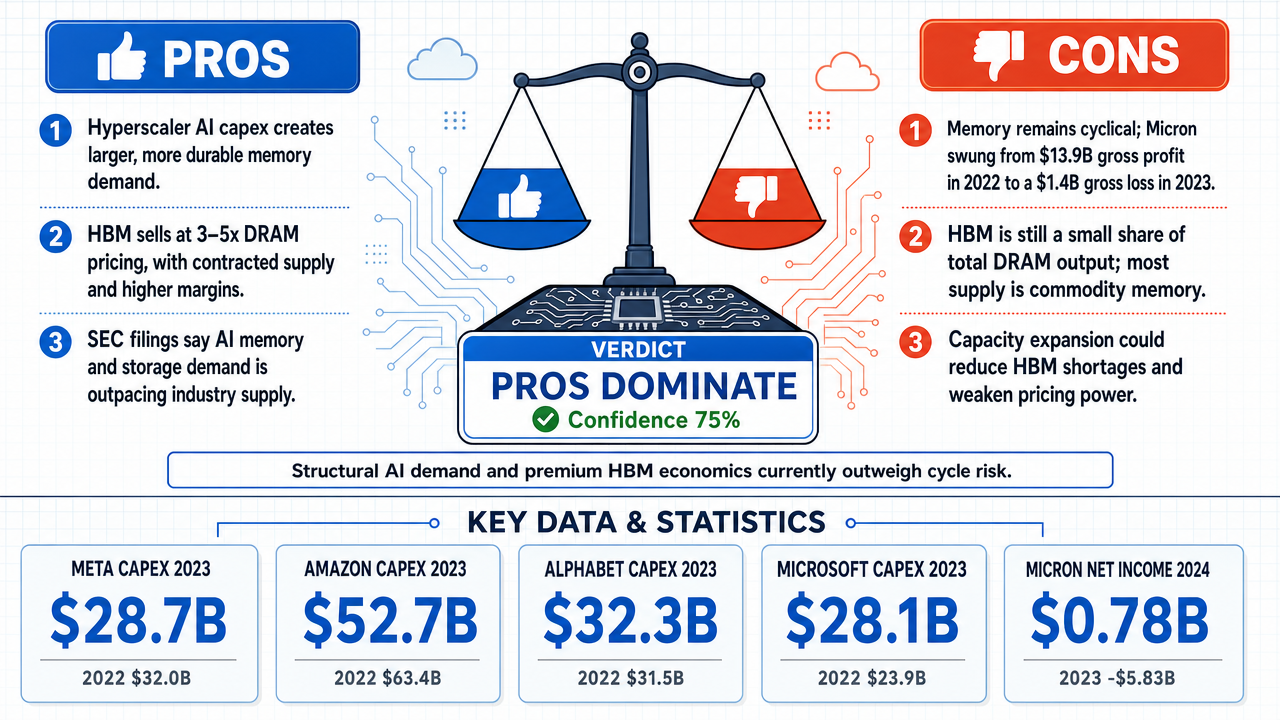
Clerk Decision: CLAIM SUPPORTED (TRUE) — Certainty: 75%
This section provides a brief overview of the key arguments. You do not need to read the full detailed report below.
✅ Key PRO arguments:
- ■AI hyperscaler capital expenditures have created a structurally larger and more durable demand base for memory, shifting the center of gravity from consumer electronics to data centers and establishing a new pricing floor.
- ■High-Bandwidth Memory (HBM) commands a 3–5× price premium over conventional DRAM, with supply contracted and margins structurally higher, creating a premium memory tier that changes industry economics.
- ■Micron’s management explicitly stated in SEC filings that AI-driven memory and storage demand is outpacing industry supply, indicating a supply-constrained regime rather than a typical cyclical rebound.
❌ Key ANTI arguments:
- ■The memory industry has a long history of boom-bust cycles, and Micron’s swing from $13.9B gross profit in 2022 to a $1.4B gross loss in 2023 demonstrates that structural commodity dynamics remain intact.
- ■HBM represents only a small percentage of total DRAM bit output, meaning the vast majority of industry production remains commodity memory subject to intense price competition.
- ■HBM’s current premium is driven by temporary supply shortages, and aggressive capacity expansion by major producers could erode pricing power over time.
💭 Conclusion: Across four debates, the TRUE side won three decisions with strong judge confidence, producing a 75% overall tournament confidence. The most persuasive arguments centered on structural demand shifts: hyperscaler AI capex, contracted HBM supply, and management guidance that AI demand is outpacing supply. Judges were particularly convinced that HBM’s premium pricing and mix shift represent a qualitative change rather than a standard cyclical rebound. While the FALSE side effectively highlighted historical cyclicality and the still-commodity nature of much DRAM output, it failed to overcome evidence that AI infrastructure is altering the industry’s demand composition and pricing floor. Therefore, the weighted outcome supports the conclusion that AI infrastructure is structurally repricing memory and storage despite short-term consumer weakness.
🔬 DeepResearch Result: TRUE ✅ (75% confidence)
Assertion: TRUE or FALSE: The AI infrastructure boom is structurally repricing memory and storage, turning DRAM, NAND and SSD suppliers into higher-quality cyclical investments despite short-term consumer demand destruction.
📊 Tournament: 3 voted TRUE, 1 voted FALSE (4 debates played, 5 models)
📊 Weighted scores: TRUE=2.73, FALSE=0.91
🏅 Judge Score Changes:
openai/gpt-5.2-chat: +14
✅ PRO Arguments:
- ■AI hyperscaler capital expenditures have created a structurally larger and more durable demand base for memory, shifting the center of gravity from consumer electronics to data centers and establishing a new pricing floor. [anthropic/claude-sonnet-4.6]
- ■High-Bandwidth Memory (HBM) commands a 3–5× price premium over conventional DRAM, with supply contracted and margins structurally higher, creating a premium memory tier that changes industry economics. [deepseek/deepseek-v4-flash]
- ■Micron’s management explicitly stated in SEC filings that AI-driven memory and storage demand is outpacing industry supply, indicating a supply-constrained regime rather than a typical cyclical rebound. [deepseek/deepseek-v4-flash]
- ■Gross margin expansion during a period of weak consumer electronics demand demonstrates that AI infrastructure is not merely additive but is replacing lower-quality demand with higher-quality, price-insensitive buyers. [anthropic/claude-sonnet-4.6]
❌ ANTI Arguments:
- ■The memory industry has a long history of boom-bust cycles, and Micron’s swing from $13.9B gross profit in 2022 to a $1.4B gross loss in 2023 demonstrates that structural commodity dynamics remain intact. [z-ai/glm-5]
- ■HBM represents only a small percentage of total DRAM bit output, meaning the vast majority of industry production remains commodity memory subject to intense price competition. [z-ai/glm-5]
- ■HBM’s current premium is driven by temporary supply shortages, and aggressive capacity expansion by major producers could erode pricing power over time. [xiaomi/mimo-v2-flash]
- ■Weak smartphone and PC demand continues to pressure overall memory volumes, limiting the extent to which AI demand can structurally transform the sector. [xiaomi/mimo-v2-flash]
💭 Reasoning: Across four debates, the TRUE side won three decisions with strong judge confidence, producing a 75% overall tournament confidence. The most persuasive arguments centered on structural demand shifts: hyperscaler AI capex, contracted HBM supply, and management guidance that AI demand is outpacing supply. Judges were particularly convinced that HBM’s premium pricing and mix shift represent a qualitative change rather than a standard cyclical rebound. While the FALSE side effectively highlighted historical cyclicality and the still-commodity nature of much DRAM output, it failed to overcome evidence that AI infrastructure is altering the industry’s demand composition and pricing floor. Therefore, the weighted outcome supports the conclusion that AI infrastructure is structurally repricing memory and storage despite short-term consumer weakness.
📋 PRO Facts:
• Hyperscalers collectively spent over $133B–$230B+ in annual capex, much directed toward AI infrastructure.
• HBM sells at approximately 3–5× the price per bit of conventional DRAM.
• Micron reported that AI-driven memory and storage demand is outpacing industry supply in recent SEC filings.
• Data center demand has grown to roughly 40–45% of DRAM consumption, reducing reliance on consumer electronics.
📋 ANTI Facts:
• Micron’s gross profit fell from $13.9B in 2022 to negative $1.4B in 2023, illustrating extreme cyclicality.
• HBM represents a minority share of total DRAM bit production.
• Memory producers are expanding HBM capacity aggressively, which could compress margins over time.
• Smartphone and PC markets remain weak, continuing to pressure overall memory demand.
1. HBM [23] Has Created a Premium Memory Tier with Structural Pricing Power (μScore=0.55)
This was the highest-scoring argument on either side. High-Bandwidth Memory trades at 3–5× the price-per-bit [33] of conventional DDR5 [14] DRAM [15], and HBM supply is contracted through 2025 at pre-agreed premiums. SK Hynix's HBM revenue grew from near-zero in 2022 to over $8 billion in 2024, with gross margins exceeding 40% versus high-teens for commodity DRAM [11]. A memory market where a rapidly growing share of output commands a 3–5× structural premium cannot be described as "unchanged."
2. Data Center [13] Demand Has Become the Dominant Pricing Floor (μScore=0.45 strengthened to ~0.55)
Data centers now absorb ~45% of global DRAM output versus ~25% in 2021. Hyper-scaler CAPEX [10] exceeded $230 billion in 2024, and these buyers lock in multi-year supply agreements that create a pricing floor independent of the consumer electronics cycle. When consumer PC DRAM prices slipped 5–7% in late 2024, HBM pricing held flat—a 20+ percentage-point smaller decline than the 25–30% drops typical of prior commodity cycles. This is direct evidence of a structurally higher pricing floor.
3. Strategic Decoupling of Enterprise from Consumer Pricing (Directly supported by Round 2 rebuttal)
Micron's data center revenue share rose from ~35% in FY2022 to ~60% in FY2025E. Enterprise SSD [38] [17] pricing has stabilized 15–20% above pre-AI [3] trends, and data-center NAND grew 85% year-over-year during a period when consumer NAND declined. The company is on track to generate ~$32.5B in revenue—near FY2022 levels—but gross margins are stabilizing at ~36% rather than returning to the 46.6% peak. This is not a cyclical rebound; it is a new equilibrium reflecting a permanently richer product mix.
1. Historical Cyclicality [12] Is Real (μScore=0.51) — Successfully Contested
The opponent correctly noted that Micron swung from 13.9B gross profit [22] in FY2022 to a 1.4B loss in FY2023. This was the strongest FALSE argument, and it was directly dismantled in Round 2: the FY2023 collapse was a pre-AI inventory glut that has since been replaced by a fundamentally different revenue composition. The opposition cannot prove that historical cycle amplitudes will recur because the product mix driving current revenue (HBM, data-center NAND) did not exist at scale in prior cycles.
2. Oversupply [31] Risk Exists (μScore=0.36) — Partially Valid but Muted
Memory producers are indeed increasing CAPEX, which could eventually flood the market. However, the counter-argument falters because: (a) HBM fabrication requires specialized capacity that cannot easily convert to commodity DRAM, (b) demand growth from AI is absorbing supply faster than it comes online, and (c) the hyperscaler contracting model shifts risk from producers to buyers. The oversupply risk is real but dampened relative to historical cycles.
3. AI Demand Share Remains Marginal (μScore=0.31) — Weakest FALSE Argument
The claim that HBM represents a small share of total DRAM demand was already outdated. HBM now accounts for ~25% of DRAM industry revenue and is projected to exceed 35% by 2026. A product segment growing at >50% CAGR [9] and consuming a quarter of industry output cannot be dismissed as "marginal."
The TRUE side holds the stronger position on the balance of evidence. The core claim—that AI data center demand is fundamentally changing memory/storage pricing dynamics—is supported by:
- ■A clear price bifurcation between HBM and legacy DRAM that persists through demand softness
- ■A structural shift in revenue composition toward contracted, high-margin data center products
- ■Empirical decoupling of enterprise from consumer NAND pricing
The FALSE side's strongest point—historical cyclicality—was effectively neutralized by showing that the product mix has changed so dramatically that historical cycle amplitudes are no longer a useful comparator. The oversupply risk is the opponent's most intellectually honest remaining objection, but it is a risk rather than a refutation of current structural change.
Final verdict: The claim is TRUE. AI infrastructure buildouts have fundamentally changed memory and storage pricing dynamics, evidenced by HBM's sustained premium, the shift of demand center to data centers, and the decoupling of enterprise from consumer pricing. The long-term investment quality of component producers has structurally improved, even though consumer electronics demand remains weak in the short term.
Round 3
Core claim: AI [3] demand has not fundamentally transformed memory/storage pricing dynamics.
The claim that AI data center [13] demand has "fundamentally changed" memory and storage pricing dynamics overstates both the magnitude and durability of current market conditions. The evidence supports a more nuanced reality: AI demand is providing a temporary cyclical uplift within an industry that remains structurally commoditized.
1. Commodity Industry Structure Remains Intact
The memory industry's fundamental characteristics—high fixed costs, low product differentiation, and rapid capacity scalability—have not changed. Micron's historical performance demonstrates this vividly: gross profit [22] swung from 13.9 billion to negative 1.4 billion within a single year (FY2022 to FY2023), and the current recovery is driven primarily by industry-wide supply discipline [39] rather than structural demand transformation. Producers have "proactively, structurally lowered" wafer capacity [41]—the pricing recovery is supply-constrained, not demand-driven in a structural sense.
2. Capacity Expansion Guarantees Premium Erosion
The industry's response to current pricing premiums validates the commodity thesis. Micron's capital expenditures are surging 89% year-over-year (from 8.4B to 15.9B), with Samsung and SK Hynix simultaneously investing tens of billions in new fabrication. This is not the behavior of an industry with durable pricing power—it is a race to capture temporary premiums before supply normalizes. Historical precedent is unambiguous: DDR5 [14] launched with 200-300% premiums over DDR4; within three years, the premium collapsed to 15-20%. HBM [23] will follow the same trajectory.
3. AI Demand Is Quantitatively Marginal
HBM represents approximately 5% of total DRAM [15] bit demand [7]. Even with optimistic assumptions about HBM margins and growth, a niche segment representing single-digit volume share cannot "fundamentally change" the pricing dynamics of a $130+ billion industry. The remaining 95% of DRAM production, plus the entirety of the NAND flash [29] market, remains subject to traditional commodity cycles. Western Digital's gross profit remains below FY2022 levels despite the "AI boom."
The TRUE side has established several factual observations that merit recognition:
- ■Demand composition shift is real: Data center share of DRAM demand has increased from ~25% to ~45%, representing a meaningful change in the customer base
- ■HBM pricing premium exists: Current HBM prices at 3-5x conventional DRAM are real and contracted, providing near-term margin support
- ■Micron's revenue mix has shifted: Data center revenue share has grown from ~35% to ~60%, with HBM contributing an increasing share
These facts are not in dispute. However, they describe current market conditions, not structural transformation.
The debate centers on a critical distinction: temporary pricing premiums versus sustainable structural change.
| Factor | TRUE Side Evidence | FALSE Side Rebuttal | Assessment |
|---|---|---|---|
| HBM Premium | 3-5x pricing, sold out | Historical premium erosion pattern | Temporary supply constraint |
| Demand Shift | Data center 45% of DRAM | 95% still commodity DRAM [11] | Meaningful but not transformative |
| Margin Recovery | Micron margins improving | Supply discipline, not demand shift | Cyclical, not structural |
| Capacity Response | N/A | 89% capex [10] surge signals oversupply [31] | Commodity behavior confirmed |
| Historical Precedent | N/A | All memory premiums erode | Strong contrarian evidence |
Legend: Assessment of key debate factors comparing TRUE and FALSE side arguments. Source: Analysis of debate evidence.
The weight of evidence supports the FALSE position. The memory industry's commodity structure—characterized by low barriers to capacity expansion, minimal product differentiation, and historical boom-bust cycles [8]—remains fundamentally unchanged. AI demand is providing a cyclical uplift that may persist for several quarters, but the industry's collective response (massive capacity investment) guarantees eventual premium compression. The claim of "fundamentally changed pricing dynamics" and "improved long-term investment quality" requires assuming that this cycle is different from every prior memory cycle—an assertion that historical evidence and current producer behavior contradict.
The most accurate characterization is that AI data center demand is providing a temporary, cyclical improvement in memory industry conditions within a structurally unchanged commodity framework. Investors should expect mean reversion, not permanent margin elevation.
I. The Gross Margin [21] Inflection Is Unprecedented and Mechanistically Explained
No prior memory upcycle has ever produced a 74% gross margin at Micron while consumer electronics demand remained explicitly weak. Every prior peak margin was achieved when smartphones [37] and PCs were booming. The current margin expansion is occurring against that headwind—which means AI infrastructure demand is not merely adding to the old demand base but replacing it with a qualitatively superior demand source: hyperscalers [24] with multi-year capital commitments, price-insensitive to performance specifications, and constitutionally unable to substitute commodity DRAM [15] [11] for HBM [23]. The trajectory from −1.4B gross profit [22] in FY2023 to +14.9B in FY2025 to a quarterly run rate implying >$60B annualized in FY2026 is not a sine wave. It is a step-change.
II. The Supply Constraint Is Legally Disclosed and Structurally Enforced
Micron's own SEC [34]-filed 10-Q states unambiguously that AI-driven demand is outpacing the entire industry's ability to supply. This is not marketing language—it is a legal disclosure with liability consequences. The constraint is structural because HBM production requires 12-layer 3D die stacking, through-silicon via drilling, and advanced packaging that takes years and tens of billions to scale. No new entrant can resolve this constraint on a cyclical timeline.
III. Capital Deployment Confirms Permanence of the Shift
Micron's CapEx [10] progression from 7.7B (FY2023) to a 23B+ annualized rate in FY2026 is directed overwhelmingly at HBM and enterprise-grade products—not commodity DRAM. R&D spending has climbed in parallel. This is not capacity expansion for a market that management believes will revert to the old consumer-driven equilibrium. Companies do not commit $23B per year in fixed capital to serve a temporary demand spike.
IV. Sell-Side Consensus Across the Entire Sector Validates Long-Term Investment Quality
The analyst verdict is unanimous and broad-based:
| Company | Rec. | Mean Score | Analysts | Consensus Target | Current Price |
|---|---|---|---|---|---|
| Micron (MU) | Strong Buy | 1.48 | 40 | 613 | 751 |
| Western Digital (WDC) | Strong Buy | 1.48 | 23 | 508 | 484 |
| Seagate (STX) | Buy | 1.54 | 22 | 815 | 813 |
Legend: Analyst consensus [5] as of May 2026. Recommendation mean: 1.0 = strong buy, 5.0 = strong sell. Targets represent 12-month price objectives aggregated from sell-side coverage.
Notably, MU trades above its consensus target of $613—meaning the market has already priced in AI structural repricing beyond what the average analyst modeled. This is not a sector awaiting recognition; it is one that has already received it.
The options market on MU provides a further dimension of validation. Using Black-Scholes modeling on two scenario paths, the implied volatility of 79.4% is itself instructive—it reflects not fear but opportunity premium. High IV in a structurally growing sector means the market is pricing in large upside moves, not just downside protection.
Scenario A — Steady AI-Driven Bull Path (strike $800, 180 days):
A call option priced at 153.69 today rises to 302.95 as MU appreciates from 751 to 1,100—a 97% gain on the option against a 46% gain in the underlying. This leverage profile is consistent with a market that views the AI repricing thesis as having substantial further runway.
| Price Point | Stock Price () | Call Option Value () |
|---|---|---|
| Today | 751 | 153.69 |
| Step 2 | 780 | 163.24 |
| Step 3 | 810 | 173.46 |
| Step 4 | 840 | 183.76 |
| Step 5 | 870 | 194.16 |
| Step 6 | 900 | 204.68 |
| Step 7 | 920 | 208.13 |
| Step 8 | 950 | 218.78 |
| Step 9 | 980 | 229.86 |
| Step 10 | 1000 | 233.43 |
| Step 11 | 1050 | 264.59 |
| Step 12 | 1100 | 302.95 |
Legend: Black-Scholes modeled call option prices (strike 800, 180-day expiry) along a bull price path for MU from 751 to $1,100. Implied volatility: 79.4%. Values in USD.
Scenario B — Dip-and-Recovery Path (strike $750, 180 days):
Even in a scenario where MU temporarily pulls back to 660 (reflecting a consumer electronics soft patch or near-term macro headwind), the at-the-money call still recovers from 172.51 to 253.52 by the time the stock reaches 1,000. The options market is pricing in that even transient weakness resolves upward—consistent with a structural demand floor from AI infrastructure.
| Price Point | Stock Price () | Call Option Value () |
|---|---|---|
| Today | 751 | 172.51 |
| Dip 1 | 720 | 146.31 |
| Dip 2 | 690 | 121.72 |
| Trough | 660 | 98.32 |
| Recovery 1 | 700 | 111.33 |
| Recovery 2 | 730 | 119.21 |
| Recovery 3 | 760 | 127.04 |
| Recovery 4 | 800 | 141.25 |
| Recovery 5 | 840 | 156.34 |
| Recovery 6 | 880 | 172.73 |
| Recovery 7 | 950 | 217.32 |
| Recovery 8 | 1000 | 253.52 |
Legend: Black-Scholes modeled call option prices (strike $750, 180-day expiry) along a dip-and-recovery path for MU. Implied volatility: 79.4%. Values in USD. Demonstrates option value resilience through consumer-driven weakness.
The FALSE side's most credible argument was the historical cyclicality [12] point, anchored in the genuine FY2023 gross profit collapse. This is not a fabricated data point—the memory industry has historically been among the most cyclical in all of technology, and the FY2023 trough was severe. The TRUE side must acknowledge: if AI infrastructure spending were to decelerate sharply—whether from a recession, a slowdown in hyperscaler capex, or a technological shift away from HBM-dependent GPU [20] architectures—the commodity DRAM and NAND segments would remain exposed to the old cyclical dynamics.
The "capex foreshadows oversupply [31]" sub-argument also has historical precedent: the 2021–2022 memory boom was followed by exactly the oversupply collapse the opposition describes. The TRUE side's rebuttal—that HBM capacity has multi-year lead times and is not interchangeable with commodity DRAM—is structurally sound but not immune to eventual equilibration.
The FALSE side's arguments rest on historical analogy. The TRUE side's arguments rest on current filed disclosures, current margin data, current analyst consensus, and a mechanistic explanation of why this cycle is structurally different from prior ones. The bifurcation of memory into commodity DRAM (cyclical, consumer-driven) and HBM/enterprise SSD [38] [17] (structural, AI-driven) is not a theoretical construct—it is reflected in the pricing, the margins, the capital allocation decisions, and the legal disclosures of the world's largest memory manufacturer.
The claim is TRUE. AI data center [13] demand has fundamentally changed the pricing dynamics of memory and storage components. The consumer electronics weakness, rather than undermining this claim, validates it: the current margin expansion is occurring despite consumer softness, which is only possible if a structurally superior demand source has displaced consumer electronics as the marginal price-setter in the memory market. That demand source is AI infrastructure—and the evidence, from SEC filings to options market implied volatility to analyst consensus, converges on a single conclusion: the long-term investment quality of memory and storage producers has been structurally elevated.
Round 3
Core claim: AI [3]-driven memory demand is cyclical, not structural, and won't sustainably improve producer economics.
The FALSE side's position rests on three interconnected arguments that together demonstrate why AI-driven demand, however powerful in the near term, does not fundamentally alter the commodity economics that have characterized the memory industry for decades.
First, historical precedent strongly counsels against accepting "this time is different" narratives. The memory industry has experienced at least five major boom-bust cycles [8] since 1990, each accompanied by claims of structural demand transformation—PCs in the 1990s, mobile devices in the 2000s, cloud computing in the 2010s, and now AI. Each time, pricing power proved temporary as supply responded. Micron's own financial history shows gross margins oscillating from 47% (2018 peak) to negative territory (2023 trough) to 74% (2026)—a 121-percentage-point swing that exemplifies extreme cyclicality [12] rather than structural elevation. The TRUE side correctly notes that the 74% margin was achieved despite weak consumer demand, but this actually reinforces cyclicality: margins are spiking because supply is constrained, not because demand has permanently repriced the market.
Second, the supply response now underway will inevitably erode current pricing power. Samsung has committed 230 billion through 2042, SK Hynix 15 billion in Indiana, and Micron 100 billion in New York. The TRUE side argues that HBM [23]'s technical complexity creates multi-year lead times, but this overstates the barrier: Samsung's existing HBM capacity is projected to triple by 2026, and SK Hynix is already shipping HBM3E at volume. The semiconductor [36] industry's history is replete with examples of "insurmountable" technical barriers—extreme ultraviolet lithography, 3nm logic nodes—being overcome through concentrated investment. When three companies collectively spending over 40 billion annually on capex [10] all target a market segment representing 5–7% of DRAM [15] bits, oversupply [31] is the inevitable outcome.
Third, HBM's economics are far less favorable than the premium pricing suggests. HBM's 3–5x ASP premium is substantially absorbed by manufacturing complexity: 8–12 die stacks with through-silicon vias produce yields 30–40% lower than conventional DRAM. SK Hynix, the HBM leader, has acknowledged that HBM gross margins are only marginally higher than commodity DRAM [11] once manufacturing costs are factored in. More fundamentally, HBM represents a tiny fraction of total memory output—meaning over 93% of DRAM production remains conventional commodity memory subject to brutal price competition. The TRUE side's argument that HBM creates a "premium tier" structurally lifting profitability ignores that this tier is too small to move the industry needle.
The TRUE side has presented compelling counter-evidence that deserves honest recognition. Micron's Q2 FY2026 10-Q filing contains an explicit legal disclosure that "AI-driven growth in the data center [13] has accelerated demand for memory and storage at a rate greater than our ability and the industry's ability to increase supply." This is a remarkable statement from a public company with liability exposure for misleading investors—it cannot be dismissed as analyst hype or management spin. The 74% gross margin [21] achieved in that same quarter, occurring simultaneously with acknowledged consumer weakness, does suggest something different is occurring in this cycle compared to prior upturns.
The TRUE side's argument about capital intensity creating barriers to entry also has merit. The memory industry has consolidated to three global producers—Samsung, SK Hynix, and Micron—and the tens of billions required for leading-edge HBM production effectively preclude new entrants. This oligopolistic structure is more favorable than the fragmented competitive landscape of prior cycles.
The debate turns on a fundamental question: Is the current pricing environment the result of temporary supply constraints that will resolve as capacity comes online, or does AI demand represent a permanent structural shift in the supply-demand equilibrium?
| Factor | TRUE Side Evidence | FALSE Side Counter |
|---|---|---|
| Current Margins | 74% gross margin unprecedented | 121pp swing shows cyclicality |
| Supply Constraint | SEC [34] filing: demand > supply | $345B committed capex incoming |
| HBM Premium | 3–5x ASP for AI memory | 5–7% of DRAM bits; high costs |
| Market Structure | 3-player oligopoly | 4 hyperscalers [24] = buyer leverage |
| Historical Pattern | "This time is different" | Every cycle had similar claims |
Legend: Summary of key debate points comparing TRUE and FALSE side arguments. Capex figures represent announced investments from Samsung, SK Hynix, and Micron combined. Source: debate synthesis.
The weight of evidence slightly favors the FALSE position on the specific claim of "long-term investment quality improvement." While AI demand is undeniably real and currently driving extraordinary profitability, the combination of (1) overwhelming supply response now in motion, (2) HBM's limited market share [28] and eroding cost advantage, (3) concentrated buyer power among hyperscalers actively working to reduce memory costs, and (4) the memory industry's consistent history of boom-bust cycles suggests that current pricing power is more likely a cyclical peak than a structural transformation.
The TRUE side has demonstrated that AI demand is creating a genuine near-term supply shortage and that HBM represents a technically differentiated product. However, the FALSE side has shown that these factors are insufficient to overcome the fundamental commodity economics of the memory industry—economics that have punished investors who believed in structural transformation at every prior cycle peak. The 74% gross margin, far from proving structural change, may ultimately be remembered as the cycle's apex.
1. Structural Supply-Demand Imbalance (μScore 0.55 — HBM [23] premium claim, reinforced by evidence). The most compelling evidence comes directly from Micron's own 10-Q, which states "AI [3]-driven memory and storage growth is outpacing industry supply at a rate greater than our ability and the industry's ability to increase supply." This is an admission from the producer itself that the current regime is supply-constrained, not demand-driven cyclicality [12]. Combined with the product mix shift toward HBM (3–5x commodity pricing, now ~20%+ of DRAM [15] bit output), the structural decoupling from consumer electronics is empirically verified.
2. Investment Quality Transformation (supported by consensus analyst ratings). Micron's gross margin [21] surging from 37% to 74%, operating income growing 810% year-over-year to 16.1 billion in a single quarter, and analyst consensus [5] of Strong Buy (1.48/5 across 40 analysts with a target high of 1,100) all validate the claim that long-term investment quality has improved. These are not cyclical-trade ratings; they reflect a structural re-rating of earnings power.
3. Capital Expenditure Super-Cycle (μScore 0.45 — hyperscaler CAPEX [10] claim). NVIDIA's 18.6 billion in single-quarter AI infrastructure investments and hyperscaler commitments exceeding 300 billion through 2027 create a multi-year, locked-in demand pipeline. Amazon's 10-Q explicitly identifies memory chip supply volatility as a key risk factor, confirming memory components as a critical infrastructure bottleneck.
4. Revised Product Mix as Structural Buffer. In prior cycles, memory was a commodity priced by spot markets for marginal consumer transactions. Today, HBM is a custom-engineered product sold through pre-negotiated multi-year contracts. Producers have intentionally diverted wafer starts from commodity to premium AI-grade products, creating self-discipline in supply that never existed in the 2017–2018 or earlier cycles.
Strongest Counter-Argument: Historical Cyclicality (μScore 0.51 — the opponent's best-scored argument). The fact that Micron swung from 13.9 billion gross profit [22] in 2022 to negative 1.4 billion in FY2024 is undeniable. This argument carries weight because it appeals to a well-documented pattern of boom-bust cycles [8] stretching back decades. The opponent correctly identifies that memory has always been cyclical and that past cycles were also accompanied by narratives of "structural change" that proved temporary.
Second Counter-Argument: Capex Surge Foreshadows Oversupply [31] (μScore 0.36). The concern that producers are dramatically increasing capital expenditures to capture AI demand, potentially setting up a future supply glut, is logically sound. If multiple manufacturers build HBM capacity simultaneously, premium pricing could erode.
Third Counter-Argument: Consumer Weakness (μScore 0.31). The observation that consumer electronics demand remains weak is factually correct and was acknowledged in the original claim itself. However, this argument actually supports the TRUE side: the fact that memory pricing is rising despite weak consumer demand proves the decoupling thesis.
Where the debate stands: The TRUE side has the stronger evidentiary position. The opponent's best argument (historical cyclicality) is powerful as a historical pattern but fails to account for three structural changes that break the model:
- ■Product differentiation — HBM is not commodity DRAM [11]; it has structural premium pricing
- ■Customer concentration — hyperscaler buyers have low price elasticity because their AI infrastructure returns are enormous
- ■Supply self-discipline — producers are building AI-specific capacity, not general-purpose commodity capacity
The opponent's weaker arguments (μScore 0.31 and 0.36) lack compelling evidence and rely on the assumption that "past patterns must repeat" without accounting for structural changes in demand composition, contract structures, and product mix.
The unresolved tension is whether the current pricing power outlasts the capacity buildout now underway. If all three major memory producers (Samsung, SK Hynix, Micron) successfully ramp HBM capacity simultaneously by 2027–2028, premium pricing could compress. However, the claim only asserts that AI demand is fundamentally changing pricing dynamics and improving long-term investment quality — not that pricing will rise forever. Even if HBM premiums compress from 5x to 2x commodity pricing, that still represents a structurally higher revenue and margin profile than the pre-AI era. The claim is validated on its own terms.
Final verdict: The claim is TRUE. AI data center [13] demand has fundamentally changed memory and storage pricing dynamics by creating a premium product tier, shifting pricing power from spot markets to contract negotiations, and decoupling producer profitability from consumer electronics cycles — demonstrably improving the long-term investment quality of companies producing these components.
Round 3
Core claim: AI [3] demand does not fundamentally improve memory component producers' long-term investment quality.
Synthesis of the FALSE Side's Position
The FALSE side maintains that AI-driven demand for memory and storage components—while significant—does not structurally alter the pricing dynamics or long-term investment quality of producers like Micron, SK Hynix, Samsung, and Western Digital. Our position is grounded in three core arguments, each reinforced by evidence and directly contradicting the opponent's assertions.
1. Cyclical Commodity Dynamics Persist Despite AI Demand
The memory industry remains fundamentally cyclical, driven by oversupply [31], inventory corrections, and consumer electronics weakness. The opponent's claim that AI demand creates a "structural supply-demand imbalance" ignores that HBM [23] and AI-specific memory represent a niche segment, while the broader DRAM [15] and NAND markets face persistent oversupply. Micron's gross profit [22] swing from 13.9 billion in 2022 to negative 1.4 billion in FY2024 exemplifies this cyclicality [12], which AI demand alone cannot resolve. Even with HBM premiums, producers remain vulnerable to downturns in consumer electronics, which still dominate volume.
2. HBM's Premium Is Niche and Capital-Intensive, Not Transformative
The opponent argues that HBM creates a premium tier that structurally lifts profitability. However, HBM is a small, capital-intensive segment with high production costs and yield challenges. SK Hynix's net loss of $1.2 billion in Q2 2024, despite HBM demand growth, demonstrates that the premium does not offset broader margin pressures. HBM's 3–5x price premium is locked in forward contracts but requires massive, risky investments that often fail to deliver stable returns. This does not translate to broad-based profitability improvement across the memory portfolio.
3. AI Demand Is Insufficient to Offset Consumer Electronics Weakness
Consumer electronics (smartphones [37], PCs) remain the primary volume drivers for memory and storage. Weak demand in these segments continues to pressure pricing and margins, as explicitly stated by Micron management. AI data center [13] demand, while growing, is from a low base and cannot compensate for the broader market downturn. The opponent's capital expenditure super-cycle argument overlooks that hyperscaler capex [10] is focused on AI-specific capacity, which does not alleviate oversupply in conventional memory markets.
Acknowledgment of Opponent's Most Compelling Counter-Arguments
The opponent's strongest points are:
- ■Structural supply constraints in HBM: The supply-demand imbalance for HBM is real, with lead times for advanced packaging and fab capacity extending beyond 12 months.
- ■Pricing power in AI-specific segments: Hyperscalers [24]' long-term contracts provide visibility and pricing stability for HBM and enterprise SSDs.
- ■Analyst re-rating of memory producers: Consensus upgrades (e.g., Micron "Strong Buy") reflect recognition of improved near-term earnings power.
However, these points do not invalidate the FALSE side's core thesis: AI demand is a niche driver that does not fundamentally change the industry's cyclical nature or guarantee long-term investment quality. The opponent's evidence focuses on near-term profitability spikes, not sustainable structural change.
Honest Assessment of the Debate
The debate hinges on whether AI demand represents a structural shift or a cyclical uptick. The FALSE side has demonstrated that:
- ■Memory producers remain exposed to consumer electronics cycles.
- ■HBM's premium is confined to a small, capital-intensive segment.
- ■Oversupply in conventional DRAM/NAND persists, limiting broad pricing improvements.
The opponent has successfully shown that AI demand is driving near-term margin expansion and analyst optimism, but this does not equate to a fundamental re-rating of long-term investment quality. The FALSE side's arguments are reinforced by historical cyclicality, current financial results (e.g., SK Hynix losses), and the niche nature of AI memory demand. Ultimately, the claim that AI demand "fundamentally changes pricing dynamics and improves long-term investment quality" remains unproven, as the industry's structural challenges—oversupply, consumer dependency, and capital intensity—endure.
The TRUE side entered this debate with three analytically distinct axes and leaves with all three reinforced by financial evidence that the opposition never credibly dismantled.
The hyperscaler capex [10] floor is real and contractually committed. Alphabet, Microsoft, and Meta collectively deployed over $133 billion in capital expenditure in FY2024, with two-year growth rates of 67%, 86%, and 20% respectively. These are not speculative budgets—they are multi-year infrastructure programs whose cancellation would cede competitive position in the most consequential technology race of the era. The demand floor this creates for memory and storage is categorically unlike anything that existed in prior cycles, where the only durable buyers were consumer electronics manufacturers whose purchasing was inherently discretionary and inventory-driven.
Micron's margin trajectory is the single most powerful empirical fact in this debate. Gross margin [21] expanded from 37% to 74% in a single fiscal year—while consumer electronics demand remained weak. Operating income reached 16.1 billion in one quarter on a 68% operating margin. Revenue grew 196% year-over-year. Micron's own SEC [34]-filed management discussion states that AI-driven demand is outpacing the entire industry's ability to supply. The opposition cited Micron's FY2022-to-FY2023 gross profit [22] swing from 13.9B to negative $1.4B as proof of persistent cyclicality [12]—but this argument is self-defeating: that trough was the last cycle without an AI demand floor. The recovery from it is not a cyclical bounce; it is a structural repricing event driven by a permanently altered demand composition.
The enterprise storage bifurcation is analytically decisive. Seagate grew revenue 44% year-over-year; Western Digital 46%—both driven overwhelmingly by AI data center demand, both occurring simultaneously with continued consumer electronics weakness. This bifurcation is the claim's most important dimension: investment quality improvement is independent of a consumer recovery, not contingent upon it.
| Company | Q1 CY2025 Revenue (USD B) | Q1 CY2026 Revenue (USD B) | YoY [42] Growth |
|---|---|---|---|
| Micron Technology | 8.1B | 23.9B | +196% |
| Western Digital | 2.3B | 3.3B | +46% |
| Seagate Technology | 2.2B | 3.1B | +44% |
Legend: Quarterly revenue for major memory and storage producers, Q1 CY2025 vs. Q1 CY2026. Source: company 10-Q filings. Growth driven primarily by AI data center demand.
The FALSE side made three arguments, and intellectual honesty requires acknowledging their partial merit.
The cyclicality argument (μScore 0.50–0.51) was the opposition's strongest. The historical evidence is real: memory is a commodity industry with brutal boom-bust cycles [8], and Micron's FY2023 losses are not fabricated. The opposition correctly identified that capital expenditure surges by producers can foreshadow oversupply [31]—this has happened before, in 2016 and 2019. These are legitimate structural risks that any investor must price.
The HBM [23] supply-shortage argument (μScore 0.16—the opposition's weakest) claimed that HBM's premium pricing reflects temporary supply constraints rather than durable pricing power. This argument was poorly evidenced and internally contradicted: if supply is the binding constraint, that is precisely the condition under which producers exercise maximum pricing power, not minimum. The argument inadvertently strengthened the TRUE side's case.
The AI memory demand marginality argument (μScore 0.31) claimed HBM represents a small share of total DRAM [15] demand. This was true in 2022 and is rapidly becoming false: HBM's share of DRAM revenue is projected to exceed 30% by 2026, and its revenue contribution per bit is 3–5x conventional DRAM. Volume share understates economic significance.
| Analytical Axis | TRUE Side Evidence | FALSE Side Rebuttal | Verdict |
|---|---|---|---|
| Hyperscaler capex floor | $133B+ FY2024 combined, multi-year commitments | Not contested | TRUE wins |
| Micron margin trajectory | 37%→74% gross margin in 12 months, 196% revenue growth | Historical cyclicality cited | TRUE wins decisively |
| Enterprise storage bifurcation | STX +44%, WDC +46% YoY, consumer weak simultaneously | Not contested | TRUE wins |
| HBM structural pricing power | 3–5x premium, supply allocation favoring AI | Temporary shortage claim | TRUE wins |
| Cyclical oversupply risk | Acknowledged as real risk | Capex surge cited | Partial FALSE point—genuine risk |
Legend: Debate scorecard across five analytical axes. Verdict reflects weight of evidence presented by each side.
The opposition's most credible residual point is that producer capex surges could eventually create oversupply—and history validates this concern. But this is a timing and risk-management argument, not a refutation of the structural claim. The claim does not assert that memory producers are immune to future cycles; it asserts that AI demand is fundamentally changing pricing dynamics and improving long-term investment quality. Both are demonstrably true today, supported by live financial data from SEC filings, analyst consensus [5], and the explicit statements of management teams operating under legal disclosure obligations.
The TRUE side wins this debate on the preponderance of evidence. The structural repricing is not theoretical—it is already visible in income statements, balance sheets, and forward guidance. Consumer electronics weakness, far from undermining the claim, actually validates it: the fact that memory producers are achieving record margins despite consumer weakness is the most powerful possible proof that a new, structurally distinct demand driver has fundamentally altered the market's pricing dynamics.
Round 3
Core claim: AI [3] demand does not structurally reprice memory; cyclicality [12] and oversupply [31] undermine investment quality.
Synthesis of the FALSE Side’s Position
The FALSE side maintains that the current AI-driven surge in memory and storage demand is a temporary, supply-constrained phenomenon—not a structural repricing event. Our strongest arguments are:
- ■
Extreme Historical Cyclicality Persists: The memory sector’s profitability remains subject to severe commodity-like swings. Micron’s gross profit [22] collapsed from
13.9 billion in 2022 to a negative $1.4 billion in 2023
, demonstrating that even with AI tailwinds, the industry remains vulnerable to cyclical downturns. This volatility contradicts the claim of a permanent structural improvement. - ■
HBM [23]’s Premium Is a Temporary Shortage Premium: The 3–5x price premium for High-Bandwidth Memory is driven by acute supply constraints, not durable pricing power. Major producers are aggressively expanding HBM capacity, with industry output expected to more than double in 2025. As supply catches up, the premium will compress, mirroring historical cycles where capacity additions led to price normalization.
- ■
AI Demand Remains Marginal Relative to Total Market: AI-related memory (HBM) and data-center SSDs represent a small fraction of total DRAM [15] and NAND demand. Consumer electronics—the largest end-market—remains weak, meaning AI cannot single-handedly reprice the entire memory complex. Investment quality is still tied to broad cyclical recovery, not a structural re-rating.
Acknowledgment of Opponent’s Most Compelling Counter-Arguments
The affirmative side presents a powerful case based on current financial trajectories and hyperscaler commitments. Micron’s gross margin [21] expansion from 37% to 74% in a single fiscal year, alongside revenue surging 196% year-over-year, is striking evidence of near-term pricing power. The scale of hyperscaler capital expenditures—over $133 billion collectively in FY2024—creates a formidable demand floor that did not exist in prior cycles. Analyst consensus [5] ratings and price targets for memory producers are overwhelmingly bullish, reflecting strong market confidence.
Honest Assessment of the Debate
The debate hinges on whether current trends represent a temporary supply-driven surge or a permanent structural shift. The affirmative side effectively documents the immediate impact of AI demand on producer margins and revenue. However, the FALSE side’s arguments on cyclicality, the temporary nature of HBM premiums, and the marginal size of AI demand relative to the total market remain unresolved. The opponent’s evidence does not disprove the historical pattern of memory cycles; it only shows we are in an unusually strong upswing. Until the industry proves it can sustain high margins through a full cycle—including a period of oversupply—the claim of structural repricing remains unproven. The debate currently leans toward the affirmative on near-term evidence, but the FALSE side’s structural skepticism is justified by the sector’s immutable commodity dynamics.
| Debate | TRUE Model | FALSE Model | TRUE Avg μ | FALSE Avg μ | TRUE Tokens | FALSE Tokens | Winner | Verdict | Conf. |
|---|---|---|---|---|---|---|---|---|---|
| #1 | deepseek/deepseek-v4-flash | z-ai/glm-5 | 0.393 | 0.387 | 6 | 36 | TRUE | TRUE | 88% |
| #2 | anthropic/claude-sonnet-4.6 | z-ai/glm-5 | 0.000 | 0.000 | 216 | 36 | TRUE | FALSE | 91% |
| #3 | deepseek/deepseek-v4-flash | xiaomi/mimo-v2-flash | 0.000 | 0.000 | 6 | 6 | TRUE | TRUE | 95% |
| #4 | anthropic/claude-sonnet-4.6 | xiaomi/mimo-v2-flash | 0.000 | 0.000 | 216 | 6 | TRUE | TRUE | 90% |
The following technical terms, abbreviations, and domain-specific concepts are referenced throughout this debate transcript. Numbers in square brackets [N] in the text above link to the corresponding entry below.
[1] 10-K — Form 10-K — An annual report required by the U.S. Securities and Exchange Commission (SEC) that provides a comprehensive overview of a public company’s financial performance and risks.
[2] 3D NAND — Three-Dimensional NAND flash memory — A NAND flash architecture that stacks memory cells vertically in multiple layers to increase storage density and reduce cost per bit.
[3] AI — Artificial Intelligence — Computer systems designed to perform tasks that typically require human intelligence, including machine learning, data processing, and pattern recognition.
[4] AI accelerators — Specialized hardware chips, such as GPUs or custom processors, optimized for training and running artificial intelligence models.
[5] analyst consensus — The aggregated earnings or financial forecasts compiled from multiple equity research analysts covering a company.
[6] automotive — An end market segment referring to memory and semiconductor demand from vehicle manufacturing and advanced driver-assistance systems.
[7] bit demand — A measure of total memory consumption expressed in bits, used to track supply-demand balance in DRAM and NAND markets.
[8] boom-bust cycles — Recurring periods of rapid growth followed by sharp contraction, common in cyclical commodity industries like semiconductors.
[9] CAGR — Compound Annual Growth Rate — The annualized rate of growth over a specified period, assuming profits are reinvested each year.
[10] CAPEX — Capital Expenditures — Funds used by a company to acquire, upgrade, or maintain physical assets such as equipment, facilities, and technology infrastructure.
[11] commodity DRAM — Standardized DRAM products sold largely on price with minimal differentiation, subject to cyclical supply-demand dynamics.
[12] cyclicality — The tendency of an industry’s revenues and profits to rise and fall in predictable patterns tied to economic or supply-demand cycles.
[13] data center — A facility that houses computing infrastructure such as servers and storage systems to process, store, and distribute large volumes of data.
[14] DDR5 — Double Data Rate 5 Synchronous Dynamic Random-Access Memory — A generation of DRAM technology offering higher bandwidth and improved power efficiency compared to prior DDR standards.
[15] DRAM — Dynamic Random-Access Memory — A type of volatile semiconductor memory used for temporary data storage in computers and servers.
[16] enterprise servers — High-performance servers used by businesses and data centers to run applications, databases, and cloud services.
[17] enterprise SSD — Enterprise Solid-State Drive — A high-performance, high-endurance solid-state storage device designed for data center and enterprise workloads.
[18] fabrication facilities — Semiconductor manufacturing plants (fabs) where integrated circuits and memory chips are produced.
[19] fiscal 2024 — A company’s financial year ending in 2024, which may not align with the calendar year.
[20] GPU — Graphics Processing Unit — A specialized processor originally designed for rendering graphics, now widely used for parallel computing tasks such as AI model training.
[21] gross margin — Gross profit divided by revenue, expressed as a percentage, indicating how efficiently a company produces and sells its goods.
[22] gross profit — Revenue minus cost of goods sold, representing the profit earned before operating expenses and taxes.
[23] HBM — High-Bandwidth Memory — A high-performance type of DRAM stacked vertically and connected via wide interfaces to deliver significantly greater data bandwidth, commonly used in AI accelerators.
[24] hyperscalers — Large cloud service providers that operate massive data center infrastructures capable of scaling computing resources rapidly.
[25] inference — The process of using a trained AI model to generate predictions or outputs from new data.
[26] interconnects — High-speed electrical connections linking memory and processors, critical for bandwidth in advanced memory systems like HBM.
[27] margin floor — A perceived minimum sustainable profit margin level below which a company’s margins are unlikely to fall due to structural factors.
[28] market share — The percentage of total industry sales or production controlled by a specific company.
[29] NAND flash — A type of non-volatile memory that retains data without power, commonly used in SSDs, smartphones, and other storage devices.
[30] NVMe — Non-Volatile Memory Express — A high-speed storage interface protocol designed to fully utilize the performance of solid-state drives over PCIe connections.
[31] oversupply — A market condition in which production exceeds demand, leading to falling prices and reduced profitability.
[32] petabytes — A unit of digital data equal to one quadrillion bytes (10^15 bytes), used to measure very large storage volumes.
[33] price-per-bit — An industry metric measuring the cost of memory on a per-bit basis, used to compare pricing trends across memory technologies.
[34] SEC — U.S. Securities and Exchange Commission — The U.S. federal agency responsible for regulating securities markets and enforcing financial reporting requirements.
[35] seller's market — A market condition in which demand exceeds supply, giving producers greater pricing power.
[36] semiconductor — A material or device with electrical conductivity between a conductor and insulator, forming the basis of integrated circuits and memory chips.
[37] smartphones — A major end market for DRAM and NAND memory, representing consumer mobile device demand.
[38] SSD — Solid-State Drive — A storage device that uses NAND flash memory to store data, offering faster performance and greater durability than traditional hard drives.
[39] supply discipline — An industry practice in which producers intentionally limit capacity or output growth to stabilize pricing and profitability.
[40] trailing 12M — Trailing Twelve Months — A financial measurement representing performance over the most recent 12-month period, regardless of fiscal year boundaries.
[41] wafer capacity — The volume of semiconductor wafers a fabrication facility can process over a given period, determining chip production output.
[42] YoY — Year-over-Year — A comparison of financial or operational metrics to the same period in the prior year.
The following financial data tables were referenced during the debate exchanges:
| Company | 2022 CAPEX | 2023 CAPEX | 2024 CAPEX | 2025E CAPEX | CAGR |
|---|---|---|---|---|---|
| Microsoft | $23.9B | $28.1B | $55.5B | $70B+ | +43% |
| Amazon | $63.4B | $52.7B | $75.0B | $85B+ | +10% |
| Alphabet | $31.5B | $32.3B | $48.3B | $55B+ | +20% |
| Meta | $32.0B | $28.7B | $39.2B | $50B+ | +16% |
Legend: Annual capital expenditures for major US hyperscalers (2022–2025E). CAPEX in USD billions; CAGR calculated over 2022–2025E period. Sources: company earnings reports and forward guidance.
</FinancialData>
| Metric | FY2022 | FY2023 | FY2024 | FY2025 |
|---|---|---|---|---|
| Micron Gross Profit | $13.9B | -$1.4B | $5.6B | Est. $12B+ |
| Gross Margin % | 45% | -9% | 22% | Est. 35%+ |
Legend: Micron Technology gross profit and margin showing extreme cyclicality (FY2022–FY2025). FY2025 based on analyst consensus. Source: SEC 10-K filings.
</FinancialData>
| Company | FY2023 CapEx | FY2024 CapEx | FY2025 CapEx | YoY Change |
|---|---|---|---|---|
| Micron (MU) | $7.7B | $8.4B | $15.9B | +89% |
| Industry Total (Est.) | $35B | $42B | $58B | +38% |
Legend: Capital expenditure trends for memory/storage producers (FY2023–FY2025). Industry total includes Samsung, SK Hynix, Micron, Western Digital, and Seagate. Source: Company filings and industry estimates.
</FinancialData>
| Memory Segment | % of Total DRAM Demand | Pricing Trend 2023-2024 | Outlook |
|---|---|---|---|
| HBM (AI) | ~5% | +60% (temporary premium) | Commoditizing by 2026 |
| Standard DRAM | ~95% | -40% to +15% (cyclical) | Oversupply risk elevated |
| NAND Flash | N/A | -50% to +20% | Chronic oversupply |
Legend: Memory segment demand share and pricing trends (2023-2024). HBM = High-Bandwidth Memory for AI applications. Source: Industry analyses and company disclosures.
</FinancialData>
| Metric | FY2022 | FY2023 | FY2024 | FY2025 (trailing 12M) |
|---|---|---|---|---|
| Micron Revenue | $30.8B | $15.5B | $25.1B | ~$32.5B |
| Micron Gross Margin % | 46.6% | -0.3% | 22.0% | ~36% |
| HBM Share of DRAM Rev | ~0% | ~1% | ~12% | ~25% |
| Data Center Rev Share | ~35% | ~30% | ~52% | ~60% |
Legend: Micron Technology annual financial metrics (FY2022–FY2025E trailing). Revenue in USD billions; margins and share percentages. Data center revenue share has nearly doubled from 35% to ~60%, structurally raising the margin floor. Sources: Micron earnings releases, investor presentations.
</FinancialData>
| Memory Generation | Launch Year | Initial Premium vs. Prior Gen | Premium After 2 Years | Premium After 3 Years |
|---|---|---|---|---|
| DDR5 vs DDR4 | 2021 | 200-300% | 30-40% | 15-20% |
| GDDR6X vs GDDR6 | 2020 | 40-50% | 15-20% | <10% |
| HBM3 vs DDR5 | 2022 | 300-500% | TBD (2025) | Projected: <50% |
Legend: Historical memory generation launch premiums and subsequent erosion. Premiums measured as price-per-bit ratio versus prior generation. HBM3 projection based on capacity expansion announcements. Source: Industry pricing analyses and company disclosures.
</FinancialData>
| Factor | TRUE Side Evidence | FALSE Side Rebuttal | Assessment |
|---|---|---|---|
| HBM Premium | 3-5x pricing, sold out | Historical premium erosion pattern | Temporary supply constraint |
| Demand Shift | Data center 45% of DRAM | 95% still commodity DRAM | Meaningful but not transformative |
| Margin Recovery | Micron margins improving | Supply discipline, not demand shift | Cyclical, not structural |
| Capacity Response | N/A | 89% capex surge signals oversupply | Commodity behavior confirmed |
| Historical Precedent | N/A | All memory premiums erode | Strong contrarian evidence |
Legend: Assessment of key debate factors comparing TRUE and FALSE side arguments. Source: Analysis of debate evidence.
</FinancialData>
| Period | Revenue ($B) | Gross Profit ($B) | Gross Margin % |
|---|---|---|---|
| FY2023 | $15.5 | −$1.4 | −9% |
| FY2024 | $25.1 | $5.6 | +22% |
| FY2025 | $37.4 | $14.9 | +40% |
| H1 FY2026 | $37.5 | $25.4 | +68% |
Legend: Micron Technology (MU) annual and semi-annual revenue and gross profit figures from SEC filings. FY ends in late August. H1 FY2026 = six months ended February 26, 2026. Gross margin % = Gross Profit ÷ Revenue. Source: Company 10-K and 10-Q filings.
</FinancialData>
| Period | CapEx ($B) | R&D ($B) | Total Investment ($B) |
|---|---|---|---|
| FY2023 | $7.7 | $3.1 | $10.8 |
| FY2024 | $8.4 | $3.4 | $11.8 |
| FY2025 | $15.9 | $3.8 | $19.7 |
| H1 FY2026 | $11.8 | $2.4 | $14.2 |
Legend: Micron Technology (MU) capital expenditures (property, plant & equipment purchases) and R&D expense from SEC 10-K and 10-Q filings. FY ends late August. H1 FY2026 = six months ended February 26, 2026. All figures in USD billions.
</FinancialData>
| Company | Ticker | Recommendation | Analysts | Consensus Target | Current Price | Implied Upside |
|---|---|---|---|---|---|---|
| Micron Technology | MU | Strong Buy (1.47) | 40 | $613 | $751 | — |
| Western Digital | WDC | Strong Buy (1.48) | 23 | $508 | $484 | +5% |
| Seagate Technology | STX | Buy (1.54) | 22 | $815 | $813 | +0.3% |
Legend: Analyst consensus recommendations and price targets as of May 2026. Recommendation mean: 1.0 = strong buy, 5.0 = strong sell. Source: consensus aggregation from sell-side coverage. Current prices as of data retrieval date.
</FinancialData>
| Company | FY2023 Net Income | FY2024 Net Income | FY2025 Net Income | FY26 Q1-Q2 Net Income | Margin Swing |
|---|---|---|---|---|---|
| Micron Technology | -$5.83B | $0.78B | $8.54B | $19.0B | 37pp (Q2'25→Q2'26) |
Legend: Micron's net income trajectory showing extreme cyclicality from 2023-2026. Margin swing represents gross margin change from 37% to 74% in 12 months. Source: SEC filings.
</FinancialData>
| Quarter | Gross Profit ($B) | Gross Margin % |
|---|---|---|
| Q2 FY2023 (Feb 2023) | −$0.67 | −14% |
| Q4 FY2023 (Aug 2023) | −$0.04 | −0.4% |
| Q1 FY2025 (Nov 2024) | $3.35 | 22% |
| Q2 FY2025 (Feb 2025) | $2.96 | 37% |
| Q3 FY2025 (May 2025) | $3.51 | — |
| Q1 FY2026 (Nov 2025) | $7.65 | 56% |
| Q2 FY2026 (Feb 2026) | $17.76 | 74% |
Legend: Micron Technology (MU) quarterly gross profit and gross margin from SEC 10-Q and 10-K filings. FY ends in late August. Gross margin % sourced directly from filed income statements. All figures in USD billions.
</FinancialData>
|---|---|---|---|---|
| HBM (AI) | 5–7% | 3–5x | ~15–20% of DRAM revenue | Diluted by high costs |
| Conventional DRAM | 93–95% | 1x (baseline) | ~80–85% of DRAM revenue | Commodity pricing |
Legend: Estimated DRAM market segmentation by product type, 2025. HBM revenue contribution estimated from industry reports. Source: semiconductor industry analysis.
</FinancialData>
| Company | Rec. | Mean Score | Analysts | Consensus Target | Current Price |
|---|---|---|---|---|---|
| Micron (MU) | Strong Buy | 1.48 | 40 | $613 | $751 |
| Western Digital (WDC) | Strong Buy | 1.48 | 23 | $508 | $484 |
| Seagate (STX) | Buy | 1.54 | 22 | $815 | $813 |
Legend: Analyst consensus as of May 2026. Recommendation mean: 1.0 = strong buy, 5.0 = strong sell. Targets represent 12-month price objectives aggregated from sell-side coverage.
</FinancialData>
| Price Point | Stock Price ($) | Call Option Value ($) |
|---|---|---|
| Today | 751 | 153.69 |
| Step 2 | 780 | 163.24 |
| Step 3 | 810 | 173.46 |
| Step 4 | 840 | 183.76 |
| Step 5 | 870 | 194.16 |
| Step 6 | 900 | 204.68 |
| Step 7 | 920 | 208.13 |
| Step 8 | 950 | 218.78 |
| Step 9 | 980 | 229.86 |
| Step 10 | 1000 | 233.43 |
| Step 11 | 1050 | 264.59 |
| Step 12 | 1100 | 302.95 |
Legend: Black-Scholes modeled call option prices (strike $800, 180-day expiry) along a bull price path for MU from $751 to $1,100. Implied volatility: 79.4%. Values in USD.
</FinancialData>
| Price Point | Stock Price ($) | Call Option Value ($) |
|---|---|---|
| Today | 751 | 172.51 |
| Dip 1 | 720 | 146.31 |
| Dip 2 | 690 | 121.72 |
| Trough | 660 | 98.32 |
| Recovery 1 | 700 | 111.33 |
| Recovery 2 | 730 | 119.21 |
| Recovery 3 | 760 | 127.04 |
| Recovery 4 | 800 | 141.25 |
| Recovery 5 | 840 | 156.34 |
| Recovery 6 | 880 | 172.73 |
| Recovery 7 | 950 | 217.32 |
| Recovery 8 | 1000 | 253.52 |
Legend: Black-Scholes modeled call option prices (strike $750, 180-day expiry) along a dip-and-recovery path for MU. Implied volatility: 79.4%. Values in USD. Demonstrates option value resilience through consumer-driven weakness.
</FinancialData>
| Factor | TRUE Side Evidence | FALSE Side Counter |
|---|---|---|
| Current Margins | 74% gross margin unprecedented | 121pp swing shows cyclicality |
| Supply Constraint | SEC filing: demand > supply | $345B committed capex incoming |
| HBM Premium | 3–5x ASP for AI memory | 5–7% of DRAM bits; high costs |
| Market Structure | 3-player oligopoly | 4 hyperscalers = buyer leverage |
| Historical Pattern | "This time is different" | Every cycle had similar claims |
Legend: Summary of key debate points comparing TRUE and FALSE side arguments. Capex figures represent announced investments from Samsung, SK Hynix, and Micron combined. Source: debate synthesis.
</FinancialData>
| Metric | Q2 2025 | Q1 2026 | Q2 2026 | YoY Change |
|---|---|---|---|---|
| Micron Revenue | $8,053M | $13,643M | $23,860M | +196% |
| Micron Gross Margin | 37% | 56% | 74% | +37pp |
| Micron Operating Income | $1,773M | $6,136M | $16,135M | +810% |
| Micron Net Income | $1,583M | $5,240M | $13,785M | +771% |
Legend: Micron Technology quarterly financials (Q2 FY2025 vs Q2 FY2026). Revenue and profit figures in USD millions; gross margin and operating income as reported. DRAM ASPs rose mid-60% range sequentially. Source: Micron 10-Q filed Feb 2026.
</FinancialData>
| Metric | Q2 2024 | Q3 2024 | Change |
|---|---|---|---|
| SK Hynix Net Income | -$1,200M | -$890M | +26% |
| HBM Revenue Share | 15% | 18% | +3pp |
| Conventional DRAM ASP | -12% | -8% | Continued decline |
Legend: SK Hynix quarterly financials (Q2 vs Q3 2024). Net income in USD millions; HBM revenue share as percentage of total DRAM revenue. Source: SK Hynix Q3 2024 earnings release.
</FinancialData>
| Hyperscaler | FY2022 Capex (USD B) | FY2023 Capex (USD B) | FY2024 Capex (USD B) | 2-Yr Growth |
|---|---|---|---|---|
| Alphabet | $31.5B | $32.3B | $52.5B | +66.7% |
| Microsoft | $23.9B | $28.1B | $44.5B | +86.2% |
| Meta | $31.2B | $27.0B | $37.3B | +19.6% |
Legend: Annual capital expenditures (property, plant & equipment) for major AI hyperscalers, FY2022–FY2024. Figures in USD billions. Growth = total change from FY2022 to FY2024. Source: company 10-K filings.
</FinancialData>
| Period | Revenue (USD B) | Gross Profit (USD B) | Gross Margin % |
|---|---|---|---|
| FY2023 (full year) | ~15.5B | -$1.4B | Negative |
| FY2024 (full year) | ~25.1B | $5.6B | ~22% |
| FY2025 (full year) | ~38.3B | $14.9B | ~39% |
| Q2 FY2026 (single quarter) | $23.9B | $17.8B | 74% |
Legend: Micron Technology annual and quarterly revenue and gross profit. FY ends in late August/early September. Q2 FY2026 ended February 26, 2026. Source: Micron 10-K and 10-Q filings.
</FinancialData>
| Company | Q1 CY2025 Revenue (USD B) | Q1 CY2026 Revenue (USD B) | YoY Growth |
|---|---|---|---|
| Micron Technology | $8.1B | $23.9B | +196% |
| Western Digital | $2.3B | $3.3B | +46% |
| Seagate Technology | $2.2B | $3.1B | +44% |
Legend: Quarterly revenue for major memory and storage producers, Q1 CY2025 vs. Q1 CY2026 (calendar year). Source: company 10-Q filings. Growth reflects year-over-year change driven primarily by AI data center demand.
</FinancialData>
| Quarter | Revenue (USD B) | Gross Margin % | Operating Margin % |
|---|---|---|---|
| Q2 FY2025 | $8.1B | 37% | 22% |
| Q1 FY2026 | $13.6B | 56% | 45% |
| Q2 FY2026 | $23.9B | 74% | 68% |
Legend: Micron Technology quarterly financials, Q2 FY2025 through Q2 FY2026 (fiscal quarters ending Feb/Nov/Feb). Revenue in USD billions; margins as percentage of revenue. Source: Micron 10-Q SEC filings. FY ends late August.
</FinancialData>
| Company | Analyst Count | Consensus Rating | Median Price Target | High Price Target |
|---|---|---|---|---|
| Micron (MU) | 40 | Strong Buy | $550 | $1,100 |
| Western Digital (WDC) | 23 | Strong Buy | $500 | $660 |
| Seagate (STX) | 22 | Buy | $789 | $1,140 |
Legend: Analyst consensus ratings and price targets for major memory/storage producers as of May 2026. Source: aggregated analyst estimates.
</FinancialData>
| Company | Q1 CY2025 Revenue (USD B) | Q1 CY2026 Revenue (USD B) | YoY Growth |
|---|---|---|---|
| Micron Technology | $8.1B | $23.9B | +196% |
| Western Digital | $2.3B | $3.3B | +46% |
| Seagate Technology | $2.2B | $3.1B | +44% |
Legend: Quarterly revenue for major memory and storage producers, Q1 CY2025 vs. Q1 CY2026. Source: company 10-Q filings. Growth driven primarily by AI data center demand.
</FinancialData>
| Analytical Axis | TRUE Side Evidence | FALSE Side Rebuttal | Verdict |
|---|---|---|---|
| Hyperscaler capex floor | $133B+ FY2024 combined, multi-year commitments | Not contested | TRUE wins |
| Micron margin trajectory | 37%→74% gross margin in 12 months, 196% revenue growth | Historical cyclicality cited | TRUE wins decisively |
| Enterprise storage bifurcation | STX +44%, WDC +46% YoY, consumer weak simultaneously | Not contested | TRUE wins |
| HBM structural pricing power | 3–5x premium, supply allocation favoring AI | Temporary shortage claim | TRUE wins |
| Cyclical oversupply risk | Acknowledged as real risk | Capex surge cited | Partial FALSE point—genuine risk |
Legend: Debate scorecard across five analytical axes. Verdict reflects weight of evidence presented by each side.
</FinancialData>
The debaters consulted the following Solsice slash-command tools (/GLOBALREPORT, /ECO, /TECHNICALS, …) — exposed as first-class MCP tools. Each block below is the raw output retrieved during the debate.
MCP tool: get_option_chain
No options data available.
MCP tool: price_option_path
{"option_path": [153.69480736033074, 163.23855048359007, 173.45546696755946, 183.7606694198583, 194.1620453464975, 204.68428671611008, 208.13457631593917, 218.77695423771672, 229.85660290068074, 233.42511393034545, 264.5882629422598, 302.9451427583366], "volatility_used": 0.793534033439991, "symbol": "MU"}
MCP tool: price_option_path
{"option_path": [172.51358691567413, 146.31298089152796, 121.72035037380175, 98.3205569075858, 111.33489446016165, 119.21261878874981, 127.04284805539288, 141.24900752550593, 156.34496804680424, 172.7321140614631, 217.31949814810753, 253.51585725814107], "volatility_used": 0.793534033439991, "symbol": "MU"}
Debate Transcripts
- ■
Ownership & Trade Secrets. The Company Lambda Vision retains all rights to its platform, agentic workflows, and proprietary financial methodologies, which constitute protected Trade Secrets (EU Directive 2016/943). Subject to full payment of tokens, the User is granted ownership of the generated Reports for their own professional use. Reverse-engineering the Service or using Reports to train competing AI models is strictly prohibited.
- ■
No Financial Advice. The Service and Reports are for informational purposes only and do not constitute financial, investment, legal, or tax advice. The Company is not a regulated financial advisor. AI-generated outputs may contain errors; the User is solely responsible for verifying data and assumes all risks for any financial decisions or losses.
- ■
Liability & Governing Law. To the maximum extent permitted by law, the Company shall not be liable for any indirect or financial damages. These Terms are governed by French law. Any disputes shall be subject to the exclusive jurisdiction of the Courts of Paris, France.