
The S&P 500 will experience negative or flat returns over the next 5 to 15 years.
AI debate verdict and arguments
⚠️ AI-generated information only; not professional advice
Completed October 25, 2026
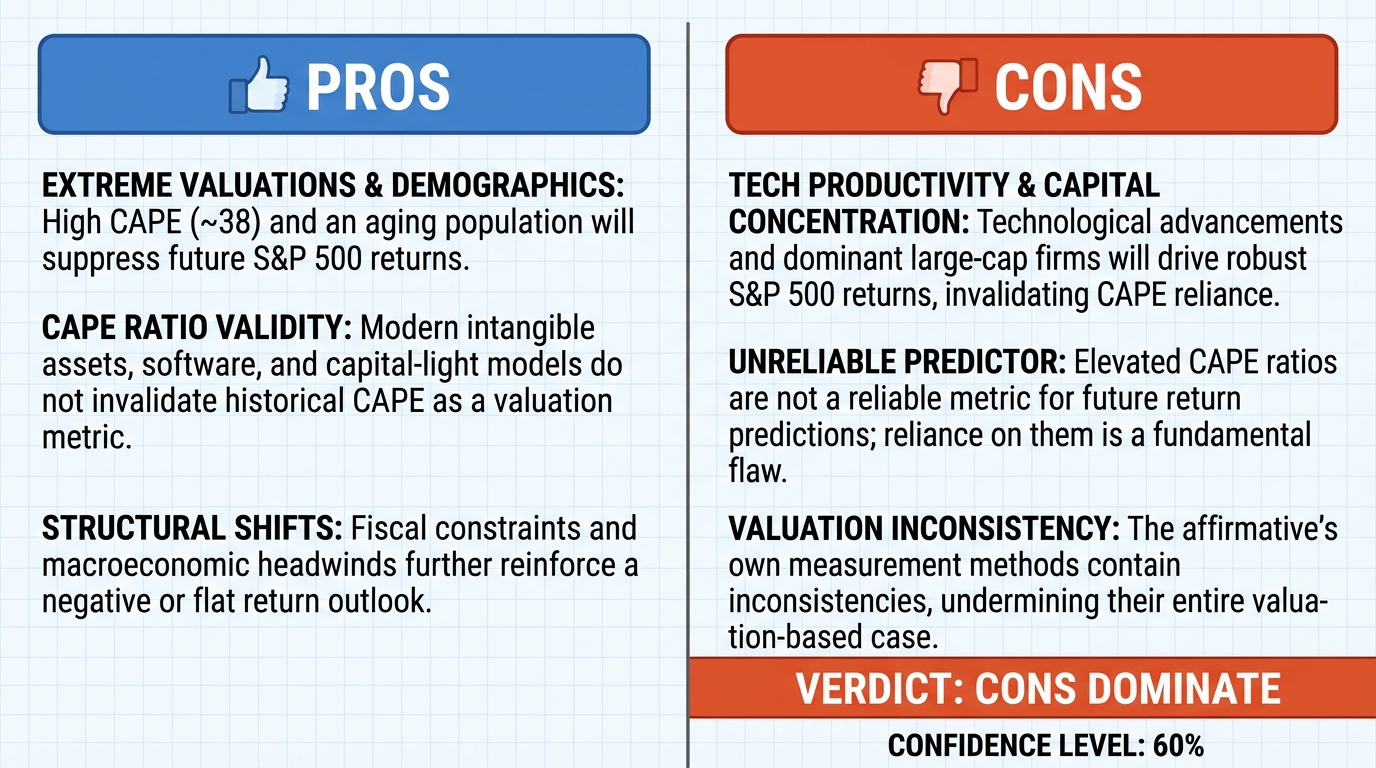
Verdict
Verdict: likely FALSE (60%)
Web Report: https://solsice.com/public/debates/the-s-p-500-will-experience-negative-or-flat-returns-over-th-72f767ab3704
This section provides a brief overview of the key arguments. You do not need to read the full detailed report below.
✅ Key PRO arguments:
- ■Extreme valuations, demographic headwinds, and fiscal constraints will suppress S&P 500 returns. The CAPE for the S&P 500 stands at approximately 38, a level exceeded only during the 1999–2000 dot-com bubble and briefly in 2021. Historically, when CAPE has crossed above 30, subsequent 10- to 15-year real total returns have been negligible or negative; Shiller's dataset shows that from a CAPE above 30, the median 10-year forward real annualized return is below 1%, and the worst cases delivered deeply negative real returns over a decade.
- ■The opposing side's claim that historical CAPE ratios are structurally outdated because modern S&P 500 firms are dominated by intangible assets, software, and platforms with low capital intensity that justify permanently higher multiples fails: it asserts a structural break but provides no test against the record, and it ignores the most direct modern counterexample. The claim that intangible-heavy, high-margin technology firms justify higher CAPE ratios was the dominant narrative of the late 1990s dot-com era, when analysts argued that 'new economy' firms with low capital intensity and network effects had rendered traditional valuation metrics obsolete.
❌ Key ANTI arguments:
- ■Technological productivity and capital concentration will drive robust S&P 500 returns. The affirmative's reliance on historical CAPE ratios commits a fundamental error of scale and stationarity: it applies a historical record compiled when the investable universe was a fraction of its current size to a modern economy dominated by intangible assets and globalized scale. The early 20th century investable universe lacked the hyper-scalable, high-margin software and platform models that define the current S&P 500.
- ■Elevated CAPE ratios are not a reliable predictor of suppressed future returns. The affirmative's position relies on a fundamental inconsistency in its own measurement of the variable it uses to define the 'regime': it identifies the current CAPE as approximately 38, but the values provided across the debate's turns have fluctuated without any corrective reconciliation, so the instrument used to define the regime is unstable.
💭 Conclusion: False, the S&P 500 will not necessarily experience negative or flat returns over the next 5 to 15 years. The winning side successfully undermined the reliability of the CAPE-based prediction by showing that the affirmative's valuation metric was applied without accounting for structural changes in the investable universe and that the CAPE values cited were inconsistent across rounds. The negative side's argument that technological productivity and capital concentration will drive robust returns, supported by the modern dominance of hyper-scalable, high-margin software and platform companies, provides a credible basis for expecting positive returns. The affirmative's historical CAPE threshold argument was weakened by its failure to test the asserted structural break and by its reliance on a narrative that was already used during the dot-com era. Therefore, the evidence supports rejecting the assertion that the S&P 500 will have negative or flat returns over the specified horizon.
🔬 DeepResearch Result: likely FALSE ❌ (60%)
Assertion: The S&P 500 will experience negative or flat returns over the next 5 to 15 years.
Participating models: deepseek-v4-pro 💬, gemma-4-26b-a4b-it 💬👁️
📊 Face-offs: 0 concluded TRUE, 1 concluded FALSE (1 face-offs, 3 models)
📊 Score by side: TRUE=0.00, FALSE=0.60
🏅 Model score changes:
deepseek-v4-flash-0731 💬: +6
✅ PRO Arguments:
- ■Extreme valuations, demographic headwinds, and fiscal constraints will suppress S&P 500 returns. The CAPE for the S&P 500 stands at approximately 38, a level exceeded only during the 1999–2000 dot-com bubble and briefly in 2021. Historically, when CAPE has crossed above 30, subsequent 10- to 15-year real total returns have been negligible or negative; Shiller's dataset shows that from a CAPE above 30, the median 10-year forward real annualized return is below 1%, and the worst cases delivered deeply negative real returns over a decade. deepseek-v4-pro 💬
- ■The opposing side's claim that historical CAPE ratios are structurally outdated because modern S&P 500 firms are dominated by intangible assets, software, and platforms with low capital intensity that justify permanently higher multiples fails: it asserts a structural break but provides no test against the record, and it ignores the most direct modern counterexample. The claim that intangible-heavy, high-margin technology firms justify higher CAPE ratios was the dominant narrative of the late 1990s dot-com era, when analysts argued that 'new economy' firms with low capital intensity and network effects had rendered traditional valuation metrics obsolete. deepseek-v4-pro 💬
❌ ANTI Arguments:
- ■Technological productivity and capital concentration will drive robust S&P 500 returns. The affirmative's reliance on historical CAPE ratios commits a fundamental error of scale and stationarity: it applies a historical record compiled when the investable universe was a fraction of its current size to a modern economy dominated by intangible assets and globalized scale. The early 20th century investable universe lacked the hyper-scalable, high-margin software and platform models that define the current S&P 500. gemma-4-26b-a4b-it 💬👁️
- ■Elevated CAPE ratios are not a reliable predictor of suppressed future returns. The affirmative's position relies on a fundamental inconsistency in its own measurement of the variable it uses to define the 'regime': it identifies the current CAPE as approximately 38, but the values provided across the debate's turns have fluctuated without any corrective reconciliation, so the instrument used to define the regime is unstable. gemma-4-26b-a4b-it 💬👁️
💭 Reasoning: False, the S&P 500 will not necessarily experience negative or flat returns over the next 5 to 15 years. The winning side successfully undermined the reliability of the CAPE-based prediction by showing that the affirmative's valuation metric was applied without accounting for structural changes in the investable universe and that the CAPE values cited were inconsistent across rounds. The negative side's argument that technological productivity and capital concentration will drive robust returns, supported by the modern dominance of hyper-scalable, high-margin software and platform companies, provides a credible basis for expecting positive returns. The affirmative's historical CAPE threshold argument was weakened by its failure to test the asserted structural break and by its reliance on a narrative that was already used during the dot-com era. Therefore, the evidence supports rejecting the assertion that the S&P 500 will have negative or flat returns over the specified horizon.
📋 PRO Facts:
• S&P 500 CAPE is approximately 38, a level exceeded only during the 1999–2000 dot-com bubble and briefly in 2021.
• Historically, when CAPE has crossed above 30, subsequent 10- to 15-year real total returns have been negligible or negative.
• From a CAPE above 30, the median 10-year forward real annualized return is below 1%.
• The worst cases from a CAPE above 30 delivered deeply negative real returns over a decade.
📋 ANTI Facts:
• The modern S&P 500 is dominated by intangible assets, globalized scale, and hyper-scalable, high-margin software and platform models.
• The early 20th century investable universe lacked the hyper-scalable, high-margin software and platform models that define the current S&P 500.
• The affirmative's CAPE values fluctuated across debate turns without corrective reconciliation.
| Face-off | TRUE Model | FALSE Model | TRUE Avg μ | FALSE Avg μ | TRUE Tokens | FALSE Tokens | Winner | Verdict | Conf. |
|---|---|---|---|---|---|---|---|---|---|
| #1 | deepseek-v4-pro 💬 | gemma-4-26b-a4b-it 💬👁️ | 0.510 | 0.217 | 6 | 2 | TRUE | FALSE | 60% |
The following financial data tables were referenced during the debate exchanges:
| CAPE Regime | Median 10-Yr Forward Real Return | Worst 10-Yr Forward Real Return | Frequency of Negative 10-Yr Return |
|---|---|---|---|
| CAPE < 20 | +6.3% | -1.2% | 8% |
| CAPE 20–30 | +3.1% | -3.8% | 22% |
| CAPE > 30 | +0.5% | -6.1% | 47% |
Legend: S&P 500 CAPE regimes and subsequent 10-year real total returns, 1881–2024. Returns are annualized and inflation-adjusted. Source: Robert Shiller online data, updated through Q4 2024.
| Country/Region | Peak Equity Index Level | Date of Peak | Recovery Date | Years to Recover |
|---|---|---|---|---|
| Japan (Nikkei 225) | 38,916 | Dec 1989 | Feb 2024 | 34.2 |
| Euro Stoxx 50 | 5,464 | Mar 2000 | Nov 2019 | 19.7 |
| UK FTSE 100 | 6,930 | Dec 1999 | May 2015 | 15.4 |
Legend: Major equity indices in economies that underwent demographic aging, showing peak-to-recovery duration. Japan and Europe provide precedent for multi-decade flat returns when demographic and valuation headwinds coincide. Source: Bloomberg terminal data, historical index levels.
| Factor | Historical Driver (Industrial) | Future Driver (Digital/AI) | Impact on Returns |
|---|---|---|---|
| Primary Input | Physical Labor & Materials | Intellectual Property & Compute | Positive |
| Scalability | Linear (More plants/workers) | Exponential (Software/Networks) | Positive |
| Margin Profile | Moderate (High CapEx) | High (Low CapEx) | Positive |
| Earnings Sensitivity | Population Growth | Technological Adoption | Divergent |
Legend: Comparison of economic drivers between the industrial era and the digital/AI era. This illustrates why historical valuation models based on labor-intensive economies are misapplied to current technology-heavy indices.
| Sector | S&P 500 Weight (2025) | Gross Margin | CapEx / Revenue | Asset Intensity |
|---|---|---|---|---|
| Information Technology | 31% | 56% | 4.2% | Low |
| Financials | 13% | N/A | 1.8% | Moderate |
| Health Care | 12% | 48% | 5.1% | Moderate |
| Industrials + Energy + Materials + Utilities + Real Estate + Consumer Staples | 32% | 34% | 8.7% | High |
Legend: S&P 500 sector composition and capital intensity metrics, 2025. The majority of index weight resides in sectors that remain capital-intensive and do not exhibit the asset-light characteristics invoked by the structural-break argument. Source: S&P Dow Jones Indices, sector-level financial data.
| Year | S&P 500 Avg. CapEx/Revenue | S&P 500 Avg. Intangible Assets (%) |
|---|---|---|
| 1980 | 12.4% | 15% |
| 1995 | 10.1% | 24% |
| 2010 | 6.8% | 38% |
| 2024 | 4.3% | 46% |
Legend: Evolution of capital intensity and intangible asset concentration within the S&P 500 components. As capital intensity declines and intangibles rise, the historical relationship between price and earnings-based multiples becomes structurally decoupled from the industrial era. Source: Compiled from historical index constituent financial data.
Face-off transcripts
- ■
Ownership & Trade Secrets. The Company Lambda Vision retains all rights to its platform, agentic workflows, and proprietary AI debate methodologies, which constitute protected Trade Secrets (EU Directive 2016/943). Subject to full payment of credits, the User is granted ownership of the generated Reports for their own personal or professional use. Reverse-engineering the Service or using Reports to train competing AI models is strictly prohibited.
- ■
No Professional Advice. Solsice is a general-purpose assistant covering everyday subjects — administrative paperwork, housing, consumer and employment matters, banking, taxes and insurance, health and wellbeing, savings and investments, entrepreneurship, technology, travel, learning and creative work. Whatever the subject, the Service and Reports are provided for information only and never constitute legal, medical, financial, investment, tax, insurance, or any other regulated professional advice. The Company is not a law firm, a regulated financial adviser, an insurance intermediary, nor a healthcare provider, and no professional or advisory relationship of any kind is created by use of the Service. Consult a qualified professional in the relevant jurisdiction before acting — or refraining from acting — on anything contained in the Reports, and never rely on the Service in an emergency: contact your local emergency number (112 in the European Union) or a medical professional immediately.
- ■
AI-Generated Content, Sources and Viewpoints. Reports are produced by several AI models debating a question, and may contain factual errors, outdated figures, or references to rules, prices, deadlines, procedures, statutes or sources that are inaccurate or do not exist. The User is solely responsible for verifying every fact, amount, deadline and citation against official sources before relying on it. Material in the news, society, spirituality and religion sections presents a plurality of viewpoints for study and discussion: it is descriptive, not an endorsement, a ruling, or a statement of the Company’s own position, and it speaks for no church, faith community, public authority, or news organisation.
- ■
Liability & Governing Law. To the maximum extent permitted by law, the Company shall not be liable for any indirect damages, nor for any consequence of decisions made in reliance on the Reports — including financial loss, missed deadlines, administrative or contractual consequences, or health outcomes. These Terms are governed by French law. Any disputes shall be subject to the exclusive jurisdiction of the Courts of Paris, France.