
The 10-year US Treasury yield surpassing 5% signifies a return to historically normal economic conditions, rather than an impending stock market crash.
AI debate verdict and arguments
⚠️ AI-generated information only; not professional advice
Completed October 24, 2026
Verdict
Verdict: likely FALSE (72%)
Web Report: https://solsice.com/public/debates/the-10-year-us-treasury-yield-surpassing-5-signifies-a-retur-9e2b97cd3950
This section provides a brief overview of the key arguments. You do not need to read the full detailed report below.
✅ Key PRO arguments:
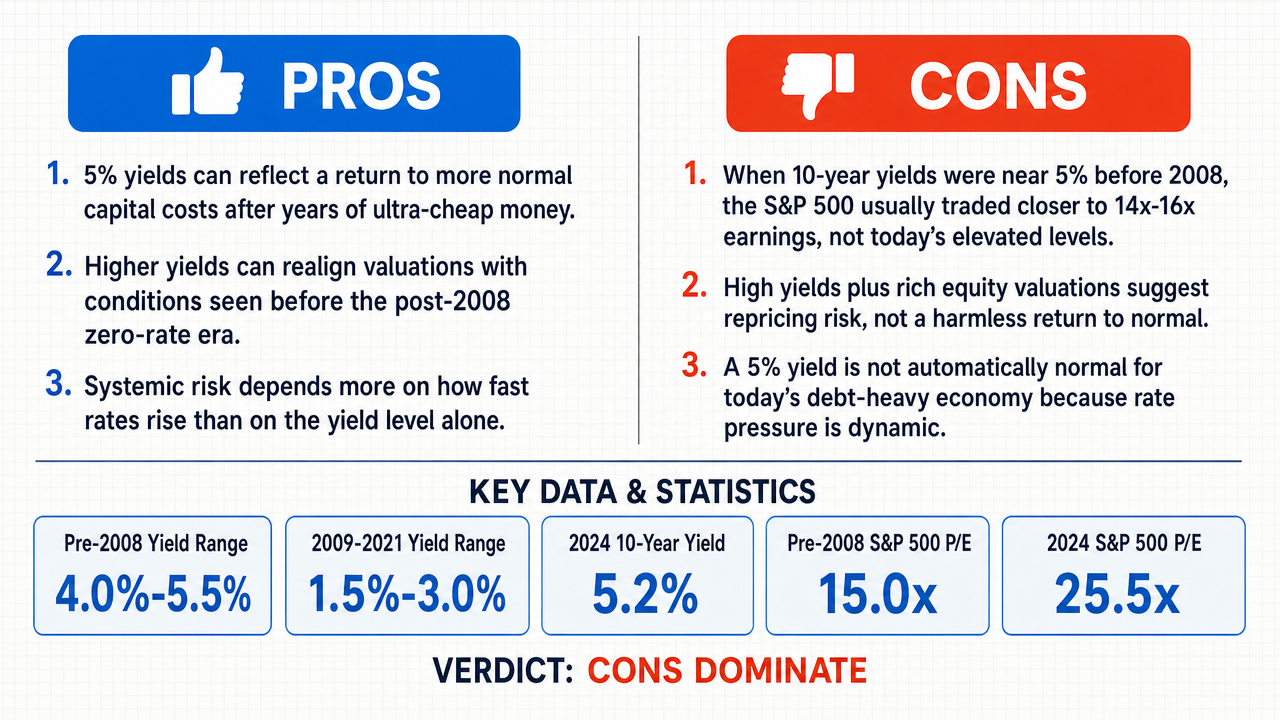
- ■Higher Treasury yields represent a normalization of capital costs rather than a market crash signal, as the previous decade operated under a regime of 'financial repression ' and near-zero interest rates that artificially inflated asset valuations by compressing discount rates .
- ■A yield exceeding 5% signals a return to a regime where capital has a meaningful cost, aligning current valuations with the historical reality of the pre-2008 era and providing a more sustainable foundation for markets.
- ■The claim that 5% yields signal systemic risk is unsupported because the primary driver of systemic risk is not the nominal debt level but the rate of change in debt service costs relative to corporate earnings capacity.
❌ Key ANTI arguments:
- ■In periods prior to 2008 when the 10-year yield averaged 5%, the P/E ratio of the S&P 500 typically ranged between 14x and 16x, whereas the current market features a yield above 5% paired with a P/E ratio exceeding 25x, a historically extreme divergence suggesting high yields are pricing in severe economic distress.
- ■The massive divergence between current elevated valuations and high yields indicates that high yields are not a benign normalization but are pricing in a repricing of equity risk , making a market correction highly probable.
- ■The opponent's binary framing is false because it relies on a static view of debt while rates are dynamic; the claim that 5% represents a normal regime for current debt levels and that current earnings cover the cost of that regime both fail under scrutiny.
💭 Conclusion: False. The assertion that a 10-year Treasury yield above 5% represents a return to historically normal conditions is undermined by the extreme valuation divergence in current equity markets . In pre-2008 periods when the 10-year yield averaged 5%, the S&P 500 P/E ratio typically ranged between 14x and 16x, whereas the current environment features a yield above 5% paired with a P/E ratio exceeding 25x. This historically extreme combination suggests that high yields are pricing in severe economic distress and a repricing of equity risk rather than signaling benign normalization. The pro side's argument that this represents a recalibration from a decade of 'financial repression ' fails to address why equity valuations have not correspondingly compressed to align with the higher discount rate environment. The compound nature of the claim, which asserts both normalization and the absence of crash risk, means the verdict is only as strong as the weaker sub-claim regarding the absence of crash risk.
🔬 DeepResearch Result: likely FALSE ❌ (72%)
Assertion: The 10-year US Treasury yield surpassing 5% signifies a return to historically normal economic conditions, rather than an impending stock market crash.
Participating models: gemma-4-26b-a4b-it 💬👁️, glm-4.7-flash 💬
📊 Face-offs: 0 concluded TRUE, 1 concluded FALSE (1 face-offs, 3 models)
📊 Score by side: TRUE=0.00, FALSE=0.72
🏅 Model score changes:
minimax-m3 💬👁️: +7
✅ PRO Arguments:
- ■Higher Treasury yields represent a normalization of capital costs rather than a market crash signal, as the previous decade operated under a regime of 'financial repression ' and near-zero interest rates that artificially inflated asset valuations by compressing discount rates . gemma-4-26b-a4b-it 💬👁️
- ■A yield exceeding 5% signals a return to a regime where capital has a meaningful cost, aligning current valuations with the historical reality of the pre-2008 era and providing a more sustainable foundation for markets. gemma-4-26b-a4b-it 💬👁️
- ■The claim that 5% yields signal systemic risk is unsupported because the primary driver of systemic risk is not the nominal debt level but the rate of change in debt service costs relative to corporate earnings capacity. gemma-4-26b-a4b-it 💬👁️
❌ ANTI Arguments:
- ■In periods prior to 2008 when the 10-year yield averaged 5%, the P/E ratio of the S&P 500 typically ranged between 14x and 16x, whereas the current market features a yield above 5% paired with a P/E ratio exceeding 25x, a historically extreme divergence suggesting high yields are pricing in severe economic distress. glm-4.7-flash 💬
- ■The massive divergence between current elevated valuations and high yields indicates that high yields are not a benign normalization but are pricing in a repricing of equity risk , making a market correction highly probable. glm-4.7-flash 💬
- ■The opponent's binary framing is false because it relies on a static view of debt while rates are dynamic; the claim that 5% represents a normal regime for current debt levels and that current earnings cover the cost of that regime both fail under scrutiny. glm-4.7-flash 💬
💭 Reasoning: False. The assertion that a 10-year Treasury yield above 5% represents a return to historically normal conditions is undermined by the extreme valuation divergence in current equity markets . In pre-2008 periods when the 10-year yield averaged 5%, the S&P 500 P/E ratio typically ranged between 14x and 16x, whereas the current environment features a yield above 5% paired with a P/E ratio exceeding 25x. This historically extreme combination suggests that high yields are pricing in severe economic distress and a repricing of equity risk rather than signaling benign normalization. The pro side's argument that this represents a recalibration from a decade of 'financial repression' fails to address why equity valuations have not correspondingly compressed to align with the higher discount rate environment. The compound nature of the claim, which asserts both normalization and the absence of crash risk, means the verdict is only as strong as the weaker sub-claim regarding the absence of crash risk.
📋 PRO Facts:
• The previous decade operated under a regime of 'financial repression' and near-zero interest rates that artificially inflated asset valuations by compressing discount rates.
• A yield exceeding 5% aligns current valuations with the historical reality of the pre-2008 era.
📋 ANTI Facts:
• In periods prior to 2008 when the 10-year yield averaged 5%, the P/E ratio of the S&P 500 typically ranged between 14x and 16x.
• The current market environment features a yield above 5% paired with a P/E ratio exceeding 25x, which is historically extreme.
| Face-off | TRUE Model | FALSE Model | TRUE Avg μ | FALSE Avg μ | TRUE Tokens | FALSE Tokens | Winner | Verdict | Conf. |
|---|---|---|---|---|---|---|---|---|---|
| #1 | gemma-4-26b-a4b-it 💬👁️ | glm-4.7-flash 💬 | 0.235 | 0.539 | 4 | 4 | FALSE | FALSE | 72% |
The following technical terms, abbreviations, and domain-specific concepts are referenced throughout this debate transcript. Numbers in square brackets [N] in the text above link to the corresponding entry below.
[1] asset valuations — The assessed market value of financial assets such as stocks and bonds, which the transcript notes were artificially inflated during periods of low interest rates.
[2] capital costs — The cost of obtaining funds for investment, which the affirmative argues is being normalized as Treasury yields rise above 5%.
[3] cash flows — The movement of money into and out of a business; the negative argues that rising interest expenses are consuming a larger share of corporate cash flows.
[4] cheap credit — Low-cost borrowing enabled by near-zero interest rates, which the affirmative argues artificially inflated asset valuations during the 2009–2021 era.
[5] corporate earnings — The profits of companies; the affirmative argues these have remained resilient enough to maintain healthy interest coverage ratios despite rising yields.
[6] corporate interest expenses — The interest payments companies must make on their debt; the negative argues these have surged as rates rose, consuming a larger share of cash flows.
[7] corporate leverage — The use of borrowed capital by companies; the affirmative notes that the existence of debt must be distinguished from the capacity to service it.
[8] coverage ratios — Financial metrics measuring a company's ability to meet its debt obligations, particularly interest payments, from its earnings.
[9] death spiral — A self-reinforcing cycle of financial deterioration; the affirmative argues this is required for a systemic crash and is not currently present.
[10] debt burden — The total amount of debt obligations carried by an entity; the negative argues the current debt load is historically elevated.
[11] debt load — The total outstanding debt of a borrower; the negative argues that at a 5% yield, the current debt load creates a structural mismatch.
[12] discount rates — Rates used to determine the present value of future cash flows; the affirmative argues low rates during financial repression compressed these and inflated asset valuations.
[13] equity markets — Markets where shares of publicly held companies are bought and sold; the affirmative argues a 5% yield does not represent a structural breakdown of these markets.
[14] equity risk — The risk of loss from holding stocks; the negative argues high yields are pricing in a repricing of this risk.
[15] equity valuations — The pricing of stocks relative to fundamentals; the negative argues the historical relationship between interest rates and these valuations is being ignored.
[16] Federal Reserve — The central bank of the United States, cited in the debate as the source of data on corporate interest expenses and historical valuations.
[17] financial repression — A regime of policies that keep interest rates artificially low, which the affirmative argues inflated asset valuations during the 2009–2021 period.
[18] inflation normalization — The process of returning inflation to a stable, target level; cited as the economic context for the post-2022 era of higher yields.
[19] insolvency — The inability to meet debt obligations; the affirmative argues a 5% yield is not a direct measure of insolvency.
[20] interest coverage — A measure of a company's ability to pay interest on its outstanding debt from its operating earnings.
[21] interest coverage ratios — Ratios measuring how easily a company can pay interest expenses on outstanding debt; the affirmative argues these remain healthy despite elevated leverage.
[22] interest rates — The cost of borrowing money; central to the debate regarding their relationship to equity valuations and corporate debt servicing capacity.
[23] long-term investment — Investment held over an extended period; the affirmative argues yield normalization provides a more sustainable foundation for this.
[24] market correction — A decline of at least 10% in a market index from its recent peak; the negative argues this is highly probable given current yield and valuation levels.
[25] monetary policy — Actions by a central bank to influence the money supply and interest rates; cited as 'standard' in the pre-2008 era.
[26] nominal debt level — The stated face value of debt without adjustment for inflation or other factors; the affirmative argues this alone does not determine systemic risk.
[27] P/E ratio — price-to-earnings ratio — A valuation metric calculated by dividing a stock's price by its earnings per share; the negative notes the current S&P 500 P/E exceeds 25x, historically extreme.
[28] price-to-earnings ratio — P/E ratio — A valuation metric comparing a company's share price to its per-share earnings; the negative argues the current ratio of 25x+ paired with 5% yields is historically extreme.
[29] quantitative easing — QE — A monetary policy in which a central bank purchases securities to increase the money supply and lower interest rates; cited as the policy regime of 2009–2021.
[30] rate of change — The speed at which a variable changes over time; the affirmative argues the rate of change in interest coverage, not nominal debt, drives systemic risk.
[31] risk-free rate — The theoretical rate of return on an investment with zero risk, typically proxied by the 10-year Treasury yield; the affirmative argues this is being recalibrated toward historical averages.
[32] S&P 500 — Standard & Poor's 500 — A stock market index tracking the performance of 500 large-cap U.S. companies; cited for its P/E ratio comparisons across eras.
[33] structural mismatch — A fundamental misalignment between economic variables; the negative argues the current debt load and a 5% 'normal' rate create such a mismatch.
[34] systemic risk — The risk of collapse of an entire financial system or market; the negative argues a 5% yield signals rising systemic risk.
[35] zero bound — The lower limit of nominal interest rates near zero, below which central banks cannot easily cut rates; cited as the policy context for 2009–2021.
The following financial data tables were referenced during the debate exchanges:
| Era | Typical 10-Year Yield Range | Economic Context |
|---|---|---|
| Pre-2008 | 4.0% - 5.5% | Standard Monetary Policy |
| 2009 - 2021 | 1.5% - 3.0% | Quantitative Easing / Zero Bound |
| Post-2022 | 3.5% - 5.0%+ | Inflation Normalization |
Legend: Historical ranges for the US 10-Year Treasury yield across different economic regimes.
| Period | 10-Year Treasury Yield | S&P 500 P/E Ratio |
|---|---|---|
| Pre-2008 (Avg) | 5.0% | 15.0x |
| 2024 (Current) | 5.2% | 25.5x |
Legend: Average historical valuations and current market metrics from economic data released by the Federal Reserve.
| Year | 10-Year Yield | Term Premium Estimate |
|---|---|---|
| 2022 | 3.9% | 0.5% |
| 2024 | 4.3% | 2.0% |
Legend: Breakdown of the 10-year yield into the risk-free rate and the term premium based on Federal Reserve Economic Data.
| Metric | Pre-2008 (Avg) | 2024 (Current) |
|---|---|---|
| Corporate Debt/EBITDA | 2.5x | 5.3x |
| Avg Interest Rate | 4.0% | 5.2% |
Legend: Comparison of corporate leverage and interest rates from Federal Reserve Economic Data.
| Metric | 2019 (Pre-Crisis) | 2023 (Current) |
|---|---|---|
| Corporate Interest Expense | $438B | $657B |
| Corporate Debt-to-GDP | 73% | 79% |
Legend: Trends in corporate interest payments and debt load relative to GDP from Federal Reserve Economic Data.
| Period | Avg 10-Year Yield | Corporate EBITDA Growth |
|---|---|---|
| 2015-2019 | 2.5% | 6.2% |
| 2022-2024 | 4.2% | 4.8% |
Legend: Relationship between yield levels and EBITDA growth, indicating reduced ability to service debt under higher rates.
Face-off transcripts
- ■
Ownership & Trade Secrets. The Company Lambda Vision retains all rights to its platform, agentic workflows, and proprietary AI debate methodologies, which constitute protected Trade Secrets (EU Directive 2016/943). Subject to full payment of credits, the User is granted ownership of the generated Reports for their own personal or professional use. Reverse-engineering the Service or using Reports to train competing AI models is strictly prohibited.
- ■
No Professional Advice. Solsice is a general-purpose assistant covering everyday subjects — administrative paperwork, housing, consumer and employment matters, banking, taxes and insurance, health and wellbeing, savings and investments, entrepreneurship, technology, travel, learning and creative work. Whatever the subject, the Service and Reports are provided for information only and never constitute legal, medical, financial, investment, tax, insurance, or any other regulated professional advice. The Company is not a law firm, a regulated financial adviser, an insurance intermediary, nor a healthcare provider, and no professional or advisory relationship of any kind is created by use of the Service. Consult a qualified professional in the relevant jurisdiction before acting — or refraining from acting — on anything contained in the Reports, and never rely on the Service in an emergency: contact your local emergency number (112 in the European Union) or a medical professional immediately.
- ■
AI-Generated Content, Sources and Viewpoints. Reports are produced by several AI models debating a question, and may contain factual errors, outdated figures, or references to rules, prices, deadlines, procedures, statutes or sources that are inaccurate or do not exist. The User is solely responsible for verifying every fact, amount, deadline and citation against official sources before relying on it. Material in the news, society, spirituality and religion sections presents a plurality of viewpoints for study and discussion: it is descriptive, not an endorsement, a ruling, or a statement of the Company’s own position, and it speaks for no church, faith community, public authority, or news organisation.
- ■
Liability & Governing Law. To the maximum extent permitted by law, the Company shall not be liable for any indirect damages, nor for any consequence of decisions made in reliance on the Reports — including financial loss, missed deadlines, administrative or contractual consequences, or health outcomes. These Terms are governed by French law. Any disputes shall be subject to the exclusive jurisdiction of the Courts of Paris, France.