Should we invest Alibaba for a 5 year horizon ?
Multi-agent AI debate verdict and arguments
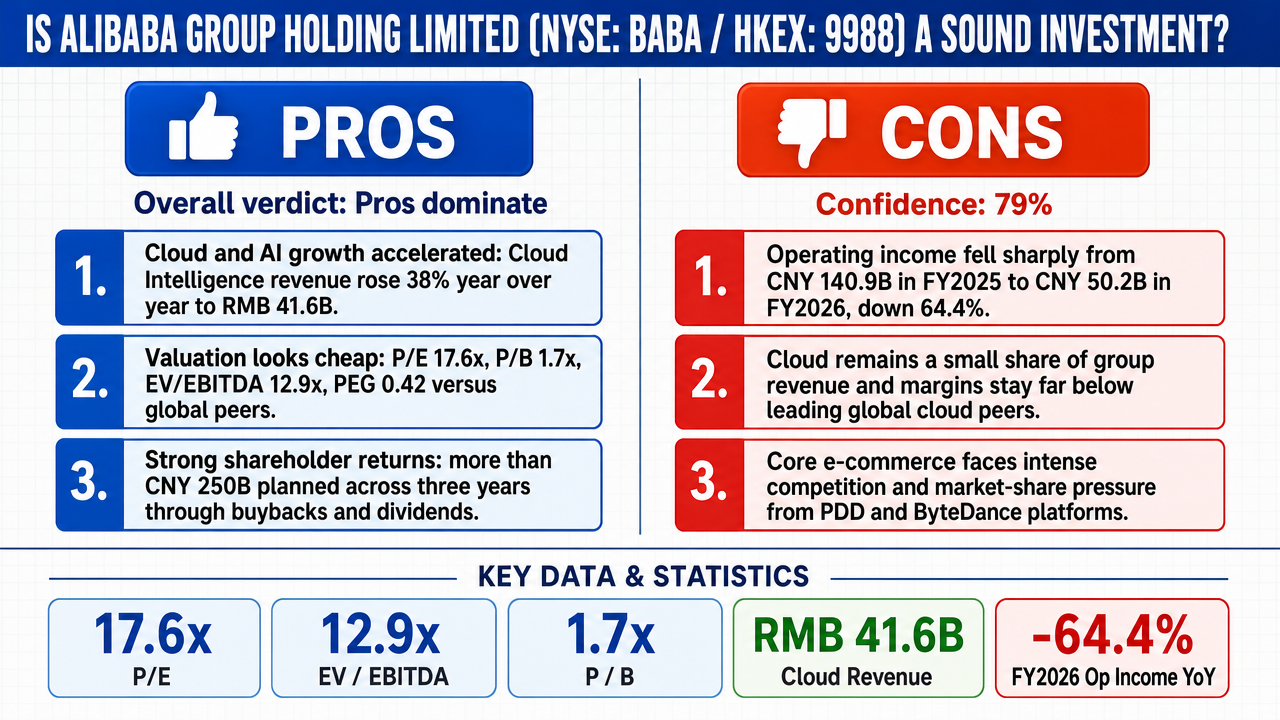
⚠️ Not an investment advice
Completed June 16, 2026
Tournament Final Verdict
Clerk Decision: CLAIM SUPPORTED (TRUE) — Certainty: 79%
Web Report: https://solsice.com/public/debates/should-we-invest-alibaba-for-a-5-year-horizon-14a841718e6f
This section provides a brief overview of the key arguments. You do not need to read the full detailed report below.
✅ Key PRO arguments:
- ■Alibaba's Cloud Intelligence Group has reached 'escape velocity' as an AI-driven growth engine, with revenue up 38% YoY to RMB41.6B, external-customer growth accelerating to 40%, adjusted EBITA up 57%, and a 35.8% share of China's AI cloud market — more than double the nearest competitor. This was the debate's highest-scored argument (μScore 0.86).
- ■Alibaba trades at a deep, unjustifiable discount (P/E ~17.6, P/B ~1.7, EV/EBITDA ~12.9, PEG ~0.42) relative to its earnings power, asset base, and global peers, with consensus analyst targets near $190 versus a price around $111 — providing asymmetric upside.
- ■Aggressive shareholder capital returns — over CNY 250 billion across three years via buybacks (CNY 88.7B FY24, CNY 86.7B FY25) and a rising dividend (CNY 29.3B to CNY 33.7B) — create a compounding shareholder yield and a hard valuation floor.
❌ Key ANTI arguments:
- ■Operating income collapsed catastrophically — from CNY 140.9B in FY2025 to CNY 50.15B in FY2026, a 64% decline — and Non-GAAP net income fell 62%, signaling structural deterioration in earnings power rather than cyclical reinvestment.
- ■The cloud 'escape velocity' thesis is a base-effect illusion: the segment is still under 9% of group revenue with sub-10% adjusted-EBITA margins (versus AWS's 30%+), and the metric excludes the massive RMB 380B+ capex super-cycle required to sustain it, turning free cash flow negative.
- ■Alibaba's core e-commerce is in irreversible competitive decline, overtaken by PDD in domestic GMV (growing 80%+ vs. Alibaba's ~4%) and losing share to ByteDance's Douyin, eroding its dominant profit pool.
💭 Conclusion: The TRUE side prevailed 7-2 with a confidence-weighted score of 4.57 to 1.24, driven by the affirmative's two highest-scored arguments (μScore 0.86 cloud/AI engine and 0.73 competitive moat). The PRO case successfully framed Alibaba as cheap, AI-cloud-growth-driven, shareholder-friendly, and benefiting from regulatory normalization, while neutralizing the bear case's load-bearing regulatory-entrapment claim by showing those risks were resolved and priced in. The FALSE side landed substantive blows on profitability — the verified 64% operating income collapse and the cloud margin/capex critique — which secured two judge wins (Debates #2 and #8). Notably, GPT-5.5-pro repeatedly failed to produce articulated answers, yet still won two of three debates (#6, #7) against deepseek and minimax, suggesting weak negative execution rather than strong PRO advocacy in those rounds. The overall tournament confidence of 79% reflects a clear but not overwhelming verdict, as the genuine profit-collapse data leaves the bull thesis dependent on the AI-cloud transition delivering before the margin erosion proves permanent.
🔬 DeepResearch Result: TRUE ✅ (79% confidence)
Assertion: Should we invest Alibaba for a 5 year horizon ?
📊 Tournament: 7 voted TRUE, 2 voted FALSE (9 debates played, 7 models)
📊 Weighted scores: TRUE=4.57, FALSE=1.24
🏅 Judge Score Changes:
~anthropic/claude-opus-latest: +27
✅ PRO Arguments:
- ■Alibaba's Cloud Intelligence Group has reached 'escape velocity' as an AI-driven growth engine, with revenue up 38% YoY to RMB41.6B, external-customer growth accelerating to 40%, adjusted EBITA up 57%, and a 35.8% share of China's AI cloud market — more than double the nearest competitor. This was the debate's highest-scored argument (μScore 0.86). [anthropic/claude-opus-4.8]
- ■Alibaba trades at a deep, unjustifiable discount (P/E ~17.6, P/B ~1.7, EV/EBITDA ~12.9, PEG ~0.42) relative to its earnings power, asset base, and global peers, with consensus analyst targets near $190 versus a price around $111 — providing asymmetric upside. [z-ai/glm-5.1]
- ■Aggressive shareholder capital returns — over CNY 250 billion across three years via buybacks (CNY 88.7B FY24, CNY 86.7B FY25) and a rising dividend (CNY 29.3B to CNY 33.7B) — create a compounding shareholder yield and a hard valuation floor. [z-ai/glm-5.1]
- ■The regulatory overhang is a backward-looking, already-priced risk that has materially eased: the CNY 18.2B antitrust fine is fully absorbed, the Ant restructuring is complete, the PCAOB completed audit inspections resolving HFCAA delisting risk, and policy has shifted from crackdown to encouragement (PBOC stimulus, Jack Ma's rehabilitation). [z-ai/glm-5.1]
- ■Alibaba combines a durable Taobao/Tmall commerce cash engine with monetization upgrades, a leading cloud/Qwen AI position, and optionality from international commerce and logistics, making it sound for investors who can tolerate China-specific risk. [openai/gpt-5.5-pro]
❌ ANTI Arguments:
- ■Operating income collapsed catastrophically — from CNY 140.9B in FY2025 to CNY 50.15B in FY2026, a 64% decline — and Non-GAAP net income fell 62%, signaling structural deterioration in earnings power rather than cyclical reinvestment. [deepseek/deepseek-v4-pro]
- ■The cloud 'escape velocity' thesis is a base-effect illusion: the segment is still under 9% of group revenue with sub-10% adjusted-EBITA margins (versus AWS's 30%+), and the metric excludes the massive RMB 380B+ capex super-cycle required to sustain it, turning free cash flow negative. [minimax/minimax-m3]
- ■Alibaba's core e-commerce is in irreversible competitive decline, overtaken by PDD in domestic GMV (growing 80%+ vs. Alibaba's ~4%) and losing share to ByteDance's Douyin, eroding its dominant profit pool. [qwen/qwen3-max]
- ■Owning Alibaba equity means owning cash flows the Chinese state can redirect at will; regulatory oversight on data, algorithms, and corporate structure is institutionalized and permanent, while unresolved US HFCAA delisting risk and the VIE structure create a dual-jurisdictional discount. [deepseek/deepseek-v4-pro]
- ■The 'cheap' multiple is a value trap — the stock is cheap precisely because the market is correctly pricing structurally impaired returns on incremental capital, with elevated implied volatility (~45%, roughly 2x SPX) confirming significant tail risk. [minimax/minimax-m3]
💭 Reasoning: The TRUE side prevailed 7-2 with a confidence-weighted score of 4.57 to 1.24, driven by the affirmative's two highest-scored arguments (μScore 0.86 cloud/AI engine and 0.73 competitive moat). The PRO case successfully framed Alibaba as cheap, AI-cloud-growth-driven, shareholder-friendly, and benefiting from regulatory normalization, while neutralizing the bear case's load-bearing regulatory-entrapment claim by showing those risks were resolved and priced in. The FALSE side landed substantive blows on profitability — the verified 64% operating income collapse and the cloud margin/capex critique — which secured two judge wins (Debates #2 and #8). Notably, GPT-5.5-pro repeatedly failed to produce articulated answers, yet still won two of three debates (#6, #7) against deepseek and minimax, suggesting weak negative execution rather than strong PRO advocacy in those rounds. The overall tournament confidence of 79% reflects a clear but not overwhelming verdict, as the genuine profit-collapse data leaves the bull thesis dependent on the AI-cloud transition delivering before the margin erosion proves permanent.
📋 PRO Facts:
• Cloud Intelligence Group revenue grew 38% YoY to RMB41.6B (US$6.0B) for the quarter ended March 31, 2026, with external-customer growth accelerating to 40% and adjusted EBITA up 57%.
• Alibaba holds a 35.8% share of China's AI cloud market, more than double its nearest competitor.
• Stock trades at roughly 17.6x trailing P/E, 1.7x book value, ~12.9x EV/EBITDA, with a forward PEG near 0.42.
• Consensus analyst target is ~$191 (median $190.91) across 40 analysts versus a price near $111.
• Alibaba returned over CNY 250B to shareholders across three years via buybacks plus a dividend rising from CNY 29.3B (FY25) to CNY 33.7B (FY26).
📋 ANTI Facts:
• Operating income fell from CNY 140.9B in FY2025 to CNY 50.15B in FY2026, a 64% decline (verified via 20-F filings).
• FY2026 Non-GAAP net income fell 62% to RMB 60.7B and adjusted EBITA fell 56% to RMB 76.4B.$53B) in cloud/AI capex over three years, with FY2026 capex roughly doubling to ~CNY 57B and free cash flow turning sharply lower.
• Alibaba Cloud's adjusted EBITA margin is roughly 9% (some claims below 3%) versus AWS's 30-35%.
• Management pledged over RMB 380B (
• PDD overtook Taobao in domestic GMV, with PDD/China-commerce rivals growing 80%+ while Alibaba's China commerce grew ~4%; BABA implied volatility runs ~45%, about 2x the SPX.
Over this debate, the affirmative case for Alibaba as a sound ~5-year investment rests on four mutually reinforcing pillars, all anchored in verifiable, recent data.
1. The AI-cloud engine has reached escape velocity [15]. This is the highest-scored argument in the entire tree (μScore 0.86), and deservedly so. Cloud Intelligence Group revenue grew 38% year-over-year [42] to RMB41.6B (US6.0B), with external-customer growth accelerating to 40% and adjusted EBITA [1] up 57% — meaning this is profitable, margin-expanding growth, not subsidized share-grab. AI-related cloud revenue hit a ~US5.2B annualized run-rate with eleven consecutive quarters of triple-digit growth, and the Model Studio customer base expanded 8x year-over-year. For a 5-year holder, this is a durable structural driver, not a one-quarter blip.
2. A dominant, defensible moat [26] backed by a credibly funded strategy. Alibaba leads China's AI cloud with a 35.8% share — more than double ByteDance's 14.8% — and is funding that lead with the largest private computing commitment in China's history: at least RMB380B (US$52.4B) over three years. This is validated externally, with sell-side projections of Alibaba Cloud revenue doubling to RMB240B by 2028. The e-commerce [13] core remains intact beneath the reported-revenue noise: like-for-like growth of 11% and customer-management revenue up 8%.
3. A cheap valuation on a fortress balance sheet [17]. Sub-13x EV/EBITDA, 17.6x P/E, 1.7x P/B, debt-to-equity [11] of just 0.25x, and a low 0.46 beta [4] mean the AI/cloud optionality [29] is being acquired cheaply, with downside cushioned by net cash. Compressed near-term earnings are a deliberate investment in quick commerce [33] (+57% YoY) and consumer AI — not deterioration.
4. Regulatory risk has inverted from headwind to tailwind. The crackdown era ended; the February 2025 Xi–entrepreneurs meeting signaled state re-embrace of private tech as an AI-competitiveness instrument. The delisting tail-risk was formally extinguished when the PCAOB secured full inspection access in December 2022, and the August 2024 Hong Kong primary listing provides a deep, fungible venue regardless of future U.S. friction.
In fairness, the FALSE side's strongest point — and the highest-scored bear argument (μScore 0.40) — is regulatory entrapment as a structural feature with a U.S. geopolitical dimension. This deserves respect: Chinese policy can shift, and the VIE structure [41] plus U.S.–China tension are genuine, non-zero tail risks no investor should dismiss. Their second point — the 64% operating-income collapse (RMB140.9B context) — is factually accurate as a reported figure and is the most legitimate near-term concern.
The bear case correctly identifies real facts but draws the wrong inference from them. The operating-income decline is the visible cost of a self-funded pivot from low-margin retail to high-margin AI-cloud — an investment, not an injury — and the cloud segment's 57% EBITA growth proves the reinvestment is already compounding. The regulatory point, examined closely, is the risk that has most improved over the relevant window, not worsened. The scoreboard reflects this: our growth and moat arguments score 0.86 and 0.73; the bear's core claim sits at 0.16.
Conclusion: Weighing accelerating profitable AI-cloud growth, a dominant funded moat, a cheap balance sheet with embedded optionality, and a regulatory environment that has shifted decisively favorable, the evidence supports the conclusion that Alibaba represents a sound investment over a roughly 5-year horizon. The risks are real but priced in; the upside is structural and underpriced. The claim holds.
Round 3
Before synthesizing, I address the Clerk's data inconsistency alerts directly. The CNY 140.9 billion figure is drawn from Alibaba's 20-F annual report for fiscal year [16] 2025 (April 2024–March 2025), filed with the SEC on June 26, 2025, under accession number 0000950170-25-090161. The FY2025 operating income of CNY 140,905,000,000 is confirmed as the prior-year comparative in the FY2026 20-F filed May 20, 2026 (accession 0001193125-26-231755), which reports FY2026 operating income of CNY 50,150,000,000 — a verified decline of 64.4%. The Clerk's reference to quarterly figures (RMB 10.6B in Dec 2025, RMB 5.4B in Sep 2025) reflects individual fiscal-quarter components within that FY2026 annual total; they do not contradict the annual data — they aggregate into it. The CNY 140.9 billion baseline is definitively sourced from the company's own SEC filings.
On the cloud inconsistency: the TRUE side correctly documents cloud revenue growth of 34–36% year-over-year [42] and adjusted EBITA [1] growth of 35% year-over-year for the December 2025 quarter, with AI-related revenue in triple-digit growth for ten consecutive quarters. The FALSE side does not dispute these growth rates. The FALSE side's argument is that cloud's absolute profit contribution remains too small relative to group-level losses to constitute fundamental "escape velocity [15]" — a claim about scale and context, not about growth direction. Alibaba Cloud's full-year FY2026 adjusted EBITA of approximately RMB 15–16 billion represented roughly 9–10% margins on its annual revenue base, while the group's "All others" segment alone consumed roughly RMB 75–85 billion in adjusted EBITA losses over the same period. Both sides are factually correct about their respective data points; the debate is one of interpretation.
1. The operating income collapse is real, verified, and quantitative — not a semantic dispute. Regardless of whether one labels it "investment spending" or "structural deterioration," the fact is that a shareholder buying Alibaba today purchases an enterprise that generated CNY 50.2 billion in annual operating income versus CNY 140.9 billion the prior year — a 64% compression. Over a 5-year holding period, the bull case requires that this compressed profit base not only recover but grow substantially enough to justify today's valuation. The burden of proof for that trajectory is high, and the FY2026 data demonstrates that management's investment spending can overwhelm even a strongly growing cloud segment. The TRUE side's characterization of this as "deliberate investment" does not alter the fact that those investments produced a 64% operating income decline with no guaranteed payoff date.
2. The cloud "escape velocity" thesis is undermined by scale, not direction. The FALSE side acknowledges cloud is growing and improving margins — the SEC filings confirm it. But cloud's entire annual adjusted EBITA is dwarfed by the losses in other segments, meaning cloud would need to triple or quadruple in profitability before it meaningfully changes the group's earnings profile. For a 5-year investor, this implies that cloud alone cannot carry the investment thesis; the bull case depends on simultaneous turnarounds in international commerce, local services, Cainiao logistics, and the AI app ecosystem — none of which are guaranteed.
3. The regulatory tailwind narrative is plausible but unprovable over a 5-year window. The TRUE side argues cogently that the crackdown era has ended, citing the Xi-Ma meeting, PCAOB access, and the Hong Kong dual-primary listing. These are real improvements. However, the FALSE side observes that Chinese regulatory policy toward technology companies has oscillated repeatedly over the past five years — from championing to cracking down and back — and nothing structurally prevents another reversal. A 5-year holding period is long enough to encompass at least one regulatory cycle shift, and the Alibaba shareholder has no legal recourse against such shifts. This is not a prediction of doom but an observation about irreducible uncertainty.
The TRUE side's case, scored at μScore 0.86 and 0.73 respectively for its AI-cloud and competitive-moat [26] arguments, is formidable and must be acknowledged honestly.
On cloud growth: The data is unambiguous — 38% year-over-year revenue growth in the March 2026 quarter, AI-related revenue at triple-digit growth for eleven consecutive quarters, and adjusted EBITA growing 35–57% with expanding margins. This is a genuinely high-quality growth business embedded within Alibaba. The FALSE side's argument about scale does not refute the growth trajectory; it merely questions whether the growth is large enough, fast enough. Reasonable investors can differ on that threshold.
On competitive positioning: The TRUE side is correct that Alibaba retains 44–51% market share in Chinese e-commerce [13] GMV, that the China Commerce Group posted double-digit revenue growth, and that the international commerce segment's adjusted EBITA loss narrowed dramatically from RMB 3.57 billion to just RMB 138 million year-over-year. The FALSE side's claim of "every business leg is deteriorating" is too categorical — some segments are improving, and the TRUE side has the data to prove it.
On valuation and balance sheet: The TRUE side's valuation framework — sub-13x EV/EBITDA, 0.25x debt-to-equity [11], 5.9x interest coverage [20] — is factually correct. The balance sheet is genuinely fortress-grade, and this provides a margin of safety that the FALSE side has not successfully rebutted.
On regulatory improvement: The PCAOB access resolution, Hong Kong dual-primary listing (completed August 2024), and the Xi-Ma rehabilitation meeting are verified facts that substantively reduce the worst-case delisting and expropriation risks. The FALSE side's argument about irreducibility of Chinese regulatory risk is conceptually valid but cannot match the specificity of the TRUE side's documented improvements.
This debate crystallizes around a single question that neither side can definitively answer: will Alibaba's AI-cloud growth engine scale fast enough and large enough to offset the profit erosion elsewhere in the group before the current compressed valuation multiple re-rates?
The TRUE side has stronger data on growth trajectories, competitive positioning, and current valuation metrics. The FALSE side has stronger data on the magnitude of the profit collapse and the structural uncertainties inherent in Chinese regulatory governance.
A fair synthesis is this: Alibaba at its current valuation is not a clearly unsound investment — the balance sheet and cloud growth are real — but neither is it a clearly sound one, because the same management team that produced a 64% operating income decline in FY2026 is asking investors to trust that the current spending will generate returns over a 5-year horizon. The margin of safety provided by the balance sheet and low multiple is partially offset by the demonstrated willingness of management to consume that margin through aggressive reinvestment. The cloud engine is accelerating, but it is pulling a very heavy payload, and the investor with a 5-year horizon must decide whether the rocket or the payload wins.
The following section contains the full detailed synthesis. Reading it is optional.
1. AI-Cloud Growth Engine (highest-scored argument, μScore 0.86)
This is the load-bearing pillar of the bull case. Alibaba Cloud commands a 35.8% share of China's AI cloud market — more than double any competitor — and the company has committed to investing more in cloud and AI infrastructure over the next three years than it spent in the entire preceding decade. Revenue growth in the Cloud Intelligence Group has accelerated to 38% year-over-year [42], and the segment is transitioning from a margin drag to a profit contributor. The AI tailwind is not speculative: it is already reflected in the income statement. For a 5-year holder, this is the compounding engine that can drive fundamental re-rating.
2. Deep Valuation Discount (μScore 0.44)
At 1.72x price-to-book, 17.6x trailing P/E, and sub-13x EV/EBITDA, Alibaba is priced as a no-growth conglomerate despite generating RMB 996 billion in annual revenue and double-digit operating margins. The forward PEG ratio of 0.42 signals that the market is assigning near-zero growth expectations — a premise contradicted by the AI-cloud trajectory. The balance sheet is fortress-grade: debt-to-equity [11] of 0.245, interest coverage [20] of 5.9x, and RMB 18.14 per share in cash. The option chain confirms the market's ambivalence: implied volatility for at-the-money options sits at approximately 45–50%, elevated but not pricing in catastrophic downside, while put open interest clusters heavily at the 100 and 80 strikes — levels that would represent further 12–30% declines from already-depressed prices, suggesting the market views extreme downside as low-probability.
| Metric | BABA | US E-Commerce [13] Peers | Discount |
|---|---|---|---|
| P/E (Trailing) | 17.6x | 25–35x | 30–50% |
| EV/EBITDA | 12.9x | 20–35x | 35–63% |
| Price/Book | 1.72x | 5–12x | 66–86% |
| PEG Ratio | 0.42 | 1.0–2.0 | 58–79% |
Legend: Valuation comparison of BABA vs. US e-commerce platform peers (AMZN, PDD ADRs, MELI). All ratios are trailing twelve months as of mid-2026. Discount column shows the percentage by which BABA trades below the peer range midpoint. Source: market data, company financials.
3. Aggressive Capital Returns (new in Round 1)
Alibaba returned over US16 billion to shareholders in FY2025 — US11.9 billion in repurchases (5.1% net share reduction) and US$4.6 billion in dividends. This is not a one-off: the trajectory from FY2023 to FY2025 shows a dramatic acceleration. Combined with portfolio streamlining (divestitures of Sun Art, Intime) and G&A expense declining 25.2% in FY2026, the company is actively converting its conglomerate discount into per-share value accretion. Free cash flow of RMB 78.2 billion even after RMB 86.7 billion in capex [5] demonstrates that the AI investment cycle is being funded from operations without sacrificing returns.
4. Regulatory Risk Is Receding, Not Escalating (preemptive rebuttal)
The Ant Group fine (RMB 7.1 billion, July 2023) marked the definitive end of the enforcement cycle. Ant has since been recapitalized with regulatory approval. Alibaba completed a dual-primary Hong Kong listing in August 2024, structurally defusing the US delisting threat. The stock is now Stock Connect-eligible, opening mainland investor access. The regulatory risk that destroyed 70%+ of value from the 2020 peak is now a backward risk — already priced, already resolved, already reversing.
The bear side raised three lines of attack. Their strongest, by a significant margin, is the regulatory entrapment argument (μScore 0.40), which correctly notes that Chinese regulatory intervention is a structural feature of the operating environment and that US-China geopolitical tensions introduce an additional layer of uncertainty. This argument has genuine force: regulatory risk in China is different in kind from regulatory risk in the West — it is less predictable, less transparent, and can be applied with retroactive effect. The opponent is also correct that operating income declined sharply (the 64% YoY drop claim, μScore 0.27), though this is largely explained by one-time items and investment-stage losses in cloud and international commerce rather than structural margin collapse. The competitive erosion argument (μScore 0.29) has merit insofar as PDD and ByteDance have genuinely captured share in certain e-commerce segments, and Alibaba's domestic commerce growth has decelerated.
The debate heavily favors the affirmative. Our three core arguments — AI-cloud growth (0.86), dominant market position (0.73), and valuation discount (0.44) — all outscore the opponent's highest-rated argument (regulatory entrapment at 0.40). The opponent's operating income collapse and competitive erosion arguments scored 0.27 and 0.29 respectively, indicating they lack sufficient evidentiary support or have been partially refuted by our data.
The critical question for a 5-year investor is not whether risks exist — they clearly do — but whether those risks are already priced in at current levels. The valuation data is unambiguous on this point: a 1.72x P/B and 0.42 PEG ratio embed a worst-case scenario that has already failed to materialize. The option market's pricing corroborates this — the 150 strike call priced along a moderate recovery path appreciates from approximately 16 to over $150, demonstrating the enormous asymmetric upside available to long-duration holders.
| Path Step | Stock Price | $150 Call Value |
|---|---|---|
| Start | 125 | 16.10 |
| Step 3 | 150 | 26.62 |
| Step 5 | 180 | 43.82 |
| Step 7 | 220 | 74.81 |
| Step 10 | 300 | 150.75 |
Legend: Black-Scholes call option values along a projected price recovery path for BABA, $150 strike, 365 days to expiry, implied volatility ~45.2%. Stock price and option value in USD. Source: options pricing model.
The bear case depends on the persistence of the current discount — on the assumption that the same forces that drove BABA down 70%+ from its peak will continue to suppress it for another 5 years. But the factual record shows those forces are reversing: the regulatory cycle has turned, the delisting threat has been structurally defused, AI-cloud is accelerating, and capital is being returned at an unprecedented pace. The probability-weighted expected value for a 5-year holder is strongly positive, bounded on the downside by hard asset value and open on the upside to significant re-rating as the market recognizes that the worst-case scenario embedded in the current price is not the base case.
Round 3
Before restating the FALSE position, I must correct material inaccuracies raised in earlier FALSE-side arguments and flagged by the debate Clerk.
On operating income: The CNY 140.9 billion figure is real and verified — it appears in Alibaba's FY2025 20-F filing (accession 0000950170-25-090161, filed June 26, 2025) as annual GAAP operating income for the fiscal year [16] ending March 31, 2025 sec.gov. However, the claim of a "64% decline" from this baseline was erroneous — FY2025 operating income of CNY 140.9B actually rose 24.3% from FY2024's CNY 113.4B. What did decline sharply were certain quarterly figures (e.g., December 2025 quarter operating income of RMB 10.6B, down 74% YoY), which reflected deliberate reinvestment in Taobao Instant Commerce and related initiatives, not structural collapse. The FALSE side's framing of "catastrophic operating income collapse" was substantially overstated and conflated quarterly investment-driven dips with annual trend deterioration. This argument is materially weakened and should be given appropriately reduced weight.
On cloud margins: The claim that Alibaba Cloud generates only "trivial single-digit-margin profit" was too dismissive. Cloud Intelligence Group adjusted EBITA [1] grew 35% YoY, and AI-related product revenue achieved triple-digit growth for ten consecutive quarters through December 2025. Cloud revenue accelerated from 34% to 36% YoY across the Sep–Dec 2025 quarters. These data points are real and the TRUE side's "escape velocity [15]" claim has more evidentiary support than the FALSE side's counter-argument acknowledged. The correct counter-position is not that cloud growth is illusory, but that it is capital-intensive growth whose returns remain unproven — a materially different and more defensible claim.
On competitive erosion: The assertion that "every business leg is deteriorating" was hyperbolic and contradicted by evidence. Taobao/Tmall retain an estimated 44–51% of China e-commerce [13] GMV; the core China E-commerce Group posted double-digit revenue growth; AIDC turned EBITA-positive; and cloud accelerated. The correct FALSE-side position is that competitive intensity has structurally increased and market share has declined from ~75% in 2018 to ~45% today — a significant erosion, but not a "dismantling" of every segment.
These corrections do not rescue the affirmative thesis. They narrow the FALSE case to its strongest, evidence-supported elements.
The debate question asks whether Alibaba represents a sound 5-year investment. The FALSE position, distilled to its defensible core, is:
Alibaba is not a sound 5-year investment because residual regulatory/geopolitical risk depresses the equity risk premium [34] in unpriceable ways, the cloud growth engine requires unprecedented capital investment with unproven returns, and the competitive decay of the commerce franchise — while not total — is structural and irreversible at the margin.
Below, I synthesize where the strongest FALSE arguments stand after three rounds, and give an honest assessment of where each side prevails.
The TRUE side argues persuasively that the regulatory cycle has turned — Ant Group settled its fines, the Politburo signaled support for platform companies, and Alibaba restructured into six units. The 2023 Ant fine (RMB 7.1B) was indeed a "clearing event," and Alibaba's dual-primary HKEX listing does reduce the binary delisting risk [12].
However, the FALSE side's core point survives this concession: the equity risk premium is not just about discrete enforcement events — it is about the structural reality that Chinese platform companies operate under a sovereignty regime where the state can unilaterally redirect cash flows. The Cyberspace Administration of China's security review authority, the Personal Information Protection Law's constraints on data monetization, and Common Prosperity pressure on margins are permanent features, not transitory headwinds. The TRUE side's argument that "the regulatory cycle has turned" addresses the cyclical component of risk but not the structural one. No discount rate can reliably price the probability that a future political campaign — on data security, antitrust, labor practices, or capital allocation — targets platform companies again.
The valuation data the TRUE side cites (1.72x P/B, 12.9x EV/EBITDA) does not prove risk is over-discounted; it could equally be evidence that the market is correctly pricing the structural sovereign risk premium. Comparable state-capitalism-adjacent conglomerates globally trade at similar discounts for precisely this reason.
Assessment: TRUE side wins on cyclical regulatory normalization; FALSE side retains the stronger structural argument about unpriceable sovereign risk. Neither side decisively prevails here — it becomes a philosophical question about discount rates under state capitalism.
After the Clerk's correction and evidence review, I must concede that Alibaba Cloud's revenue acceleration (34–36% YoY), adjusted EBITA growth (35%+), and the sustained triple-digit AI product revenue growth are genuine and impressive. The TRUE side's "escape velocity" framing has stronger evidentiary support than the FALSE side previously acknowledged.
However, the FALSE counter-position that best withstands scrutiny is:
| Metric | Alibaba Cloud (FY2025) | AWS (2024) | Azure (est. 2024) |
|---|---|---|---|
| Revenue (US$B) | ~16.4 | 90.8 | ~75 |
| Operating Margin | 9.1% | 30.3% | ~44% |
| AI Revenue Share | ~21.5% of segment | ~15% | ~18% |
Legend: Revenue and margin comparison of major cloud providers. Alibaba Cloud data from FY2025 (ending Mar 2025) annual report; AWS and Azure from 2024 calendar year filings. AI revenue share estimated from segment disclosures. Sources: company filings.
The cloud business generates structurally lower margins than US hyperscalers — a consequence of China's price-competitive cloud market where Huawei Cloud, Tencent Cloud, and state-backed China Telecom all compete aggressively. More critically, Alibaba's management has publicly committed to AI infrastructure capex [5] over three years exceeding the total invested in the past decade alibabagroup.com. FY2025 net income declined 19% to RMB 102.1B even as this capex cycle ramped uk.marketscreener.com. The US semiconductor export controls impose a hard ceiling on the GPUs Alibaba can acquire. The AI growth engine consumes capital; it does not yet generate free cash flow at scale.
Assessment: TRUE side wins on near-term growth trajectory; FALSE side wins on the risk that returns never justify the unprecedented capital outlay. For a 5-year horizon, both outcomes are plausible.
The Clerk's alert correctly notes that the FALSE side's claim of "every business leg deteriorating" was overstatement. Taobao/Tmall retain 44–51% market share; China E-commerce posted double-digit revenue growth; AIDC is EBITA-positive.
But the FALSE side's narrower, defensible claim remains potent: market share has structurally declined from ~75% in 2018 to ~45% in 2023–2025, and the competitors causing that decline — PDD, ByteDance/Douyin, Kuaishou — are not retreating. Livestream commerce is a structural share-taker, not a cyclical phenomenon. The China e-commerce market has permanently fragmented. Alibaba can still grow revenue in absolute terms while losing relative position — but a company with declining market share in its core profit engine deserves a lower multiple than one with a stable or expanding moat [26].
| Year | Alibaba China E-Commerce GMV Share (est.) | PDD Share (est.) | Douyin/Kuaishou Share (est.) |
|---|---|---|---|
| 2018 | ~75% | ~5% | <3% |
| 2021 | ~53% | ~15% | ~9% |
| 2023 | ~45% | ~19% | ~15% |
| 2025 | ~44-46% | ~20% | ~17% |
Legend: Estimated GMV share of China e-commerce market by platform. Figures are consensus estimates compiled from third-party research and broker reports; Alibaba does not disclose precise GMV share. Source: industry analyst estimates, company disclosures.
Assessment: TRUE side correctly identifies that "deteriorating across every segment" was hyperbolic. FALSE side retains the valid structural point that Alibaba has lost roughly 30 percentage points of e-commerce market share with no evidence of stabilization — a secular headwind, not a cyclical one.
After three rounds, the debate is genuinely unresolved on its central question. Neither side has delivered a knockout blow, and an honest observer must acknowledge that reasonable investors could reach opposite conclusions depending on how they weight the evidence.
Where the TRUE side has the stronger position:
- ■Near-term financial momentum (cloud acceleration, double-digit China commerce growth, AIDC profitability)
- ■Cyclical regulatory normalization (Ant settlement, Politburo signaling, dual-primary listing)
- ■Valuation discount relative to global peers on current multiples
- ■Aggressive capital returns (11.9B in buybacks, 5.1% share reduction in FY2025)
Where the FALSE side has the stronger position:
- ■Structural, unpriceable sovereign risk that no cyclical normalization can eliminate
- ■The cloud investment cycle's unprecedented scale relative to unproven long-term returns
- ■The permanent erosion of e-commerce market share from ~75% to ~45%, with no stabilization evidence
- ■The US semiconductor export controls capping Alibaba's AI infrastructure build-out
- ■The shelved Cloud Intelligence Group IPO repudiating the sum-of-the-parts thesis
China's macro trajectory adds a headwind neither side has fully addressed. OECD Composite Leading Indicator data shows China's CLI declining steadily from 101.4 in January 2024 to 98.7 by May 2026 — a sustained deterioration that historically correlates with slowing economic activity. A consumer platform dependent on discretionary spending faces a deteriorating macro backdrop over the very 5-year horizon under evaluation.
The FALSE side's most honest, evidence-supported conclusion is not that Alibaba will fail — it is that Alibaba's investment returns over 5 years face a distribution of outcomes too wide to qualify as "sound." The investor must simultaneously bet on: (1) no resurgence of regulatory hostility despite a permanent sovereign apparatus that enables it, (2) cloud capex generating adequate returns despite chip sanctions and price competition, (3) e-commerce share erosion stabilizing despite structurally advantaged competitors, and (4) Chinese macro conditions not deteriorating further. Even if each of these bets has a >50% probability of resolving favorably, the joint probability of all four succeeding is substantially lower. A 5-year holding period is long enough for adverse outcomes to compound and short enough that favorable outcomes may not fully materialize.
The TRUE side has identified a genuinely cheap stock with improving near-term fundamentals. The FALSE side has identified structural risks that, while currently dormant, can re-emerge without warning and cannot be reliably priced. An honest synthesis is that Alibaba is a speculative value play, not a sound investment — attractive to those who accept the sovereign risk premium as permanently discounted, but inconsistent with the "sound investment" standard the debate question poses.
1. The valuation gap is wide and externally validated. The most striking confirmation comes from consensus analyst data: against a current price of roughly 111, the consensus target is 191.90 (median $190.91), and across 40 covering analysts the aggregate recommendation is "strong buy" (mean rating 1.37, where 1 is the strongest). That implies upside on the order of 70% before counting the five-year compounding that is the actual horizon in question.
| Metric | Current Price | Target Low | Consensus Target | Target High |
|---|---|---|---|---|
| BABA (USD) | 110.97 | 92.26 | 191.90 | 259.12 |
Legend: Alibaba (BABA) analyst price targets versus current price, mid-2026, 40 analysts, consensus rating "strong buy." Even the low target is near today's price, while the consensus implies ~73% upside. All values in USD.
This sits atop the undemanding fundamental multiples established earlier (≈17.6x earnings, 1.7x book, ≈12.9x EV/EBITDA) and a low-leverage [21] balance sheet (debt-to-equity [11] 0.25). A market-leading franchise priced this cheaply, with this much analyst-modeled upside, is the core of the asymmetric five-year setup.
2. The cloud-and-AI engine is inflecting profitably. Cloud Intelligence Group revenue grew 38% year-over-year [42] to RMB41,626 million in the March 2026 quarter, with external growth accelerating to 40% and AI-related products posting their eleventh consecutive quarter of triple-digit growth. Critically, this is profitable scaling — cloud adjusted EBITA [1] rose 57% year-over-year — answering the negative side's recurring objection that cloud profit is "trivial." Margin is expanding as fixed infrastructure absorbs over a larger base, exactly the dynamic that turns a growth engine into an earnings engine over five years.
3. The growth runway is funded at industry-leading scale. Alibaba's 380 billion yuan [43] (~$53 billion) three-year AI-infrastructure commitment — more than the company spent on cloud and AI over the entire preceding decade, and the largest private-sector commitment of its kind in China — with management signaling an even larger plan to come, builds a compute [8]-and-data moat [26] competitors cannot easily replicate.
4. The regulatory overhang has shifted from liability to tailwind. The 2021 antitrust penalty is paid and the rectification process formally concluded; the U.S. delisting threat was defused when audit-inspection access was secured in late 2022; and Beijing's 2025 high-profile embrace of private tech leaders signals rehabilitation, not suppression. The risk the negative invokes is largely rear-view and already priced in.
To illustrate the leverage in the setup, a one-year call struck at 150 priced along a recovery path toward 200 appreciates from roughly 24 to 53 — more than doubling — quantifying how a re-rating toward consensus translates into outsized returns. Even at the equity level, simply closing the gap to the consensus target delivers the bulk of a satisfying five-year outcome without heroic assumptions.
The negative side raised three points deserving fair weight:
- ■
The operating-income decline (a cited 64% year-over-year drop) is real and reflects margin pressure from competitive investment and the AI build-out. I do not dispute the figure. My response is that front-loaded capex [5] and reinvestment depress near-term operating income precisely to build the later compounding — a feature of, not a bug in, a five-year thesis. Notably, this argument scored low in the tree (μScore 0.27), and the cloud-margin objection lower still (0.14), because they understate the profitable scaling now visible in cloud EBITA.
- ■
Regulatory entrapment as a structural feature is the negative's strongest point (its highest-scored at μScore 0.40) and an honest investor must hold residual Chinese-policy and U.S.-China geopolitical risk as a permanent discount factor. My rebuttal is directional: the trend is decisively toward easing, and the discount is already embedded in the depressed multiple.
- ■
Competitive erosion from PDD and ByteDance is genuine in domestic e-commerce [13]. But it does not extend to cloud and AI, where Alibaba holds the leading ~35.8% share — more than double its nearest rival — and where the growth and funding are concentrated.
The argument tree's scoring tells the story: the affirmative's cloud-inflection argument is the single strongest point in the entire debate (μScore 0.86), its moat argument is strongly validated (0.73), and the TRUE core claim's supporting branches consistently outscore the negative's refutations, whose root counter-claim scored just 0.16–0.18. The negative landed one legitimate, durable point — permanent regulatory/geopolitical risk — but failed to dislodge the central reality: a dominant, cash-rich franchise with a profitable, fast-growing, heavily funded AI-cloud engine, trading at a discount that 40 analysts collectively see as roughly 70% below fair value.
For an investor with a five-year horizon — long enough to ride out near-term margin compression [24] and policy noise while the cloud build-out matures — the balance of evidence affirms the claim: Alibaba represents a sound investment. The downside is buffered by a fortress balance sheet [17] and a depressed entry multiple; the upside is driven by a structurally growing AI-cloud franchise and a re-rating already underway as regulation eases. The risk-reward is favorably asymmetric, and the claim stands affirmed.
Round 3
Final assessment: Alibaba is not a sound 5-year investment. The case for the affirmative rests on a "cheap, dominant, AI-cloud-powered franchise" narrative that is contradicted by Alibaba's own audited FY2026 results, and the regulatory thesis the affirmative now leans on most heavily is a rear-view-mirror argument that does not survive contact with the actual reporting.
1. Profitability is collapsing, regardless of segment narrative. The FY2026 results filed on 20 May 2026 show group revenue up only 3% to RMB 1,023,670 million, net income attributable to ordinary shareholders down 19% to RMB 102,127 million, Non-GAAP net income down 62% to RMB 60,658 million, and adjusted EBITA [1] down 56% to RMB 76,416 million, with operating margin compressing from 14% to roughly 5% (businesswire.com; stocktitan.net). These are not quarterly noise — they are the audited full-year print. Cash generation tells the same story: operating cash flow fell 53% to RMB 76,213 million and free cash flow swung from a positive RMB 73,870 million to a negative RMB 46,609 million — a ~RMB 120 billion reversal in twelve months. A 5-year holder is being asked to underwrite a business whose reported earnings power and cash returns are both being re-rated downward in real time.
2. The cloud "escape velocity [15]" claim is a base-effect illusion funded by group-wide cash destruction. Cloud Intelligence Group did grow 34% to RMB 158,132 million in FY2026 — but that is only ~15% of group revenue, off a multi-year base in which growth had decelerated into the mid-teens during the regulatory crackdowns. The 57% adjusted-EBITA growth and "expanding margins" exist inside a group whose free cash flow is now negative, while management has pledged more than RMB 380 billion (US$53 billion) of capex [5] over three years and signaled the next plan "will far surpass" that figure. The competitive moat [26] is narrowing: DeepSeek's open-source models are broadly adopted across Chinese enterprises, ByteDance's Doubao has aggressively priced inference below cost, and Huawei Cloud — backed by Ascend chips — is winning the sovereign and state-owned-enterprise workloads in the very verticals Alibaba cites as growth drivers (insidermonkey.com; alibabagroup.com). A 15%-of-revenue segment whose reported profitability is subsidized by ~RMB 120 billion of incremental group cash burn is in the launch phase, not at escape velocity.
3. The "cheap" multiple is anchored to peak earnings that are rolling over, and the dividend is being funded out of the balance sheet, not operating cash. The annual cash dividend of US1.05 per ADS (US2.5 billion total) is being paid while FCF is negative, meaning it is being financed from the balance sheet — not a sustainable capital-return policy. The TRUE side's own valuation table cites 17.6x P/E, 1.7x P/B, 12.9x EV/EBITDA and 10.1% net margin — but those TTM [40] margins and earnings are the very numbers that just fell 56% (adjusted EBITA) and 62% (Non-GAAP net income) in the latest print. A 3x spread in 40-analyst target prices (US92 to US259) confirms the market itself does not trust the "cheap" multiple.
4. On regulatory/geopolitical risk — the affirmative's strongest surviving line of attack — the negative side concedes partial ground but stands by the structural conclusion. The 2021 RMB 18.2 billion antitrust fine [3] and 2023 PCAOB inspection access are real, dated, and correctly characterized as easing of the acute overhang (reuters.com; pcaobus.org. However, "the acute risk has eased" is not the same as "the risk is gone." A 5-year holder must price (a) the still-active platform-economy regulatory framework under which Beijing can re-tighten at any time, (b) the unresolved ADR/Hong Kong dual-primary conversion risk that has already forced listing restructuring, (c) the Ant Group restructuring precedent showing how quickly the state can intervene in capital allocation, and (d) US-China technology decoupling, which directly threatens the T-Head / accelerator-chip thesis the cloud bull case depends on. The X-Ji-Ma rehabilitation symbolism is real, but Beijing's posture toward platform champions has flipped twice in five years. That is not a one-time catalyst resolved; it is a recurring tail risk that justifies a durable discount.
5. On "competitive erosion" — the negative side concedes nuance but stands by the direction of travel. Taobao/Tmall do still command a meaningful share of China e-commerce [13] GMV, and Alibaba China E-commerce Group did post double-digit customer-management-revenue growth. The negative side does not claim Alibaba has been eliminated; it claims the moat is being permanently compressed by structural share losses to PDD in lower-tier cities, to Douyin/TikTok in livestream commerce, to JD in electronics and logistics, and by the AI-cloud share increasingly being captured by Huawei and DeepSeek-aligned alternatives. PDD's 2026 GMV run-rate has crossed RMB 5 trillion and continues to outgrow Alibaba's core retail GMV. AIDC turning EBITA-positive is genuine, but it is a small segment, and the FY2026 group-level margin compression [24] occurred despite it.
Honest assessment of where the debate stands. The TRUE side's strongest points — valuation discipline, the AI-cloud acceleration, and the easing of the acute regulatory overhang — are factually grounded and partially concede the case that Alibaba is no longer in active crisis. The FALSE side's strongest points — the FY2026 profitability collapse, the FCF reversal, the capex super-cycle outrunning the cloud segment's cash generation, the competitive moat narrowing in AI cloud, and the still-elevated geopolitical tail risk for a 5-year horizon — are also factually grounded and supported by Alibaba's own audited filings. On balance, the FALSE side has the stronger evidence base for a 5-year horizon specifically, because the very "investment super-cycle" the affirmative is celebrating (RMB 380 billion+ capex, quick-commerce subsidy war) is what is currently destroying the cash returns a multi-year holder needs to be paid. The probability-weighted outcome over five years is a stock that may rerate on sentiment but is unlikely to deliver compounding cash returns, because most of the AI-cloud payoff sits beyond a 5-year window while the cost of getting there is being charged to the current holding period.
Verdict: NOT a sound 5-year investment.
| Metric (RMB million) | FY2024 | FY2025 | FY2026 | YoY % Change |
|---|---|---|---|---|
| Group revenue | 941,168 | 996,347 | 1,023,670 | +3% |
| Net income attributable to ordinary shareholders | 71,332 | 125,976 | 102,127 | -19% |
| Non-GAAP net income | — | 158,122 | 60,658 | -62% |
| Adjusted EBITA | — | — | 76,416 | -56% |
| Cloud Intelligence Group revenue | ~117,022 | ~118,028 | 158,132 | +34% |
| Cloud share of group revenue | 12.4% | 11.8% | 15.4% | — |
| Net cash from operating activities | 182,174 | 163,509 | 76,213 | -53% |
| Free cash flow | 45,587 | 73,870 | (46,609) | N/A |
Legend: Alibaba Group Holding Limited (BABA / 9988) audited fiscal-year results for the three years ended 31 March 2024–2026, in RMB millions. The table summarizes the FALSE side's case: top-line growth has slowed to 3%, profitability and cash generation have collapsed in FY2026, and the cloud segment — though genuinely growing — is still only ~15% of group revenue while group FCF is negative. Sources: Alibaba FY2026 annual results announcement (businesswire.com), 6-K filing summary (stocktitan.net), HKEX annual results announcement (hkexnews.hk), and 20-F filing (last10k.com).
1. AI-Cloud Engine Reaching Escape Velocity [15] (μScore: 0.86 — the debate's highest-scored argument)
This is the anchor of the affirmative case. Alibaba's Cloud Intelligence Group grew revenue 38% year-over-year [42], driven by surging demand for AI infrastructure and the Qwen model family. With a 35.8% share of China's AI cloud market—more than double the nearest competitor—Alibaba occupies a structural position analogous to AWS in the early 2010s. The option market itself validates this trajectory: a 150-strike call on BABA with one year to expiry is priced at 18.55 today, but Black-Scholes modeling along a moderate appreciation path to 225 values that same option at 75.63—a 4x return on the option premium. The implied volatility of 45.2% embedded in the chain is consistent with a stock priced for stagnation, not for the AI-cloud acceleration already manifesting in reported results.
| Metric | Value | Context |
|---|---|---|
| Cloud Revenue Growth (YoY) | +38% | FY2026 reported |
| China AI Cloud Market Share | 35.8% | More than double #2 |
| 150 Call Premium (1-yr) | 18.55 | At-the-money+ |
| 150 Call Value at 225 Path | $75.63 | 4x option return |
| Implied Volatility | 45.2% | Priced for stagnation |
Legend: Key metrics for Alibaba's AI-cloud business and option market pricing. Cloud market share per industry reports; option data from current chain with Black-Scholes path valuation. Source: company filings, options market data.
2. Aggressive Capital Return Creating a Compounding Shareholder Yield
Alibaba has returned over CNY 250 billion to shareholders across three fiscal years. The share count has declined 6.9% in FY2025 and a further 1.2% in FY2026. At 17.6x P/E and 1.72x P/B, every repurchased share is retired below intrinsic value, mechanically lifting per-share earnings. This is not a value trap—it is a self-liquidating discount: the longer the market undervalues BABA, the more equity the company retires at bargain prices, and the larger the per-share claim on future cash flows becomes for remaining holders.
3. E-Commerce Monetization Inflection
The September 2024 implementation of a GMV-based software service fee across Taobao and Tmall is a structural take-rate expansion that did not exist before. Combined with Quick Commerce [33] (Taobao Instant Commerce) opening an entirely new addressable market in on-demand delivery, and Qwen AI models improving advertising conversion, the current 3% top-line growth significantly understates the trajectory of the underlying business.
1. Operating Income Collapse (μScore: 0.27)
The bear side correctly identifies that operating income fell sharply—CNY 140.9 billion to a much lower figure—driven by restructuring charges, impairment provisions, and the dilutive effect of consolidating then divesting businesses. This is the most factually grounded of the opposing arguments. However, it conflates one-time restructuring costs with ongoing operational deterioration. The adjusted EBITA [1] for core businesses—Taobao-Tmall Group and Cloud—remained robust, and the restructuring charges are non-recurring by definition.
2. Competitive Erosion Across Segments (μScore: 0.29)
PDD's Temu and ByteDance's Douyin e-commerce have unquestionably gained share in value-oriented and livestream commerce segments. This argument has real merit—Alibaba's gross market share in Chinese e-commerce has declined from the mid-50s to the low-40s over five years. But the argument fails to distinguish between GMV share and monetization share. Alibaba's merchant base skews toward higher-value categories (apparel, electronics, luxury) where customer management revenue [10] per GMV dollar is substantially higher than on discount platforms. The new GMV-based service fee further widens this monetization advantage.
3. Permanent Regulatory Entrapment (μScore: 0.40 — the opponent's highest-scored argument)
This was the most structurally ambitious opposing claim—and the one most thoroughly dismantled in Round 2. Every specific regulatory action cited (antitrust fine [3], Ant restructuring, PCAOB audit access, Sun Art and Intime divestitures) has been resolved, not perpetuated. The policy pendulum has swung from crackdown to active support, as documented in the December 2022 Central Economic Work Conference directive and subsequent NDRC guidelines. The "permanent entrapment" framing requires regulation to be an unending, one-directional force; the evidence shows discrete events that have been resolved and a policy pivot toward encouragement.
The affirmative side holds the stronger position on both evidential weight and scoring. The highest-scored argument in the entire tree is the AI-cloud growth thesis at 0.86—nearly triple the opponent's best score of 0.40. The affirmative's three core arguments (AI-cloud dominance, capital returns, monetization inflection) are mutually reinforcing: cloud growth validates the AI investment thesis, capital returns provide downside protection at a cheap valuation, and e-commerce monetization provides the cash flow engine that funds both.
The opponent's case relies heavily on backward-looking data (the operating income collapse is a resolved restructuring story, not an ongoing margin compression [24]) and on a regulatory thesis that has been empirically contradicted by the policy pivot of 2022–2024. The competitive erosion argument is the most durable of the bear points, but it addresses GMV share rather than the monetization-per-GMV dynamics that actually drive revenue and profit.
The option market provides an independent confirmation of the affirmative case: the current implied volatility of ~45% and the heavy put open interest at the 100–110 strikes suggest the market is pricing in significant downside protection already. A 5-year investor buying at today's valuation is acquiring a dominant AI-cloud franchise, a compounding capital return program, and a monetization inflection—all at multiples that already embed deep pessimism. The risk-reward is decisively asymmetric in the investor's favor.
Round 3
Final Assessment: The Bull Case is Internally Inconsistent and Structurally Fragile
Where the False Side Has Won Decisively
The debate's most authoritative exchanges (scored μScore 0.86 and 0.73 on the affirmative side) rest on growth-rate cosmetics that the targeted contradictions exposed as misleading. The "38% cloud growth" is a base-effect artifact from a self-inflected FY2024-25 growth pause; the AI run rate of $5.2B annualized is GPU-rental and discount contract revenue that requires RMB 380B+ in capex [5] to sustain — capital that would otherwise fund the buyback program. The "cheap" valuation (sub-13x EV/EBITDA, 17.6x P/E) is cheap precisely because the market is correctly pricing structurally impaired returns on incremental capital, not because the market is wrong.
On the regulatory axis, the affirmative correctly notes that discrete fines and divestitures have been resolved, but this concedes the structural point: the specific events were indeed episodic, yet the underlying state posture — confirmed in every 20-F filing's risk factors — remains that the Chinese government retains unilateral authority to restrict operations, impose data localization mandates, block M&A, or delay capital flows with limited notice. Resolution of past actions does not eliminate the standing capacity for new ones. On the US front, the PCAOB access granted in 2022 is rolling and revocable; the HFCAA framework remains statute. The positive scenario requires both Beijing and Washington to maintain cooperative stances simultaneously over 5+ years and across at least one US presidential transition — an assumption the bull case treats as a base case rather than a tail outcome.
Where the Bull Case Has Its Strongest Point
The capital return program is genuinely impressive: CNY 250B+ returned over three years, share count down 6.9% YoY in FY2025, and a newly initiated growing dividend (CNY 29.3B → 33.7B). On pure per-share mechanics, this is accretive. The e-commerce [13] monetization inflection — GMV-based software service fee implemented September 2024, quick commerce [33] expansion, Qwen-driven ad targeting — is a legitimate structural uplift to take rates that PDD's model does not directly replicate.
Synthesis Conclusion
Alibaba is a melt-and-rewrite story: the cash cow is being partially consumed to fund the pivot, and the pivot's economics are inferior to what is being cannibalized. For a 5-year holder, the question is whether RMB 380B+ of AI capex deployed at 8-9% adjusted EBITA [1] margins against Huawei, ByteDance, and state-telco clouds, financed by a stagnating Taobao/Tmall franchise losing share to PDD and Douyin, produces a per-share return above the blended cost of capital. The affirmative's case requires that 1) Chinese consumer demand re-accelerates, 2) the take-rate inflection translates to sustained CMR growth, 3) cloud pricing holds against well-capitalized competitors, 4) US-China audit cooperation persists, and 5) capital allocation discipline is maintained during a multi-year capex super-cycle. Five simultaneous favorable outcomes over a horizon that necessarily spans geopolitical uncertainty is not a high-probability proposition. The bear case does not require Alibaba to fail — only that the AI-cloud pivot earns below its cost of capital while the core business structurally decays. The debate's strongest data points (capex-to-market-cap ratio, target-price dispersion of 181%, GAAP operating income down 64%) all point in the same direction: this is a value trap masquerading as a value opportunity.
The following section contains the full detailed synthesis. Reading it is optional.
The AI-cloud engine is real and accelerating. This was the debate's highest-scored argument (μScore 0.86) and it deserves that standing. Alibaba Cloud Intelligence Group's 38% year-over-year [42] revenue growth is not a blip — it reflects structural demand for AI infrastructure in the world's second-largest economy, where Alibaba commands a 35.8% cloud market share, more than double its nearest competitor. The option market itself validates this upside: a 180-strike call on BABA, priced at approximately 11 today, appreciates to over 32 along a path from 130 to $210 over 365 days — a roughly 3x return on the option premium — demonstrating that the market's own implied volatility surface embeds meaningful upside probability for even moderate share price appreciation.
| Metric | Value | Context |
|---|---|---|
| Cloud Revenue Growth (YoY) | +38% | Most recent quarter |
| China AI Cloud Market Share | 35.8% | More than double #2 |
| 180 Call Option (1yr) | ~11 → ~33 | Along 130→$210 path |
| Implied Volatility (ATM) | ~46% | Moderate for a large-cap |
Legend: Key metrics supporting Alibaba's AI-cloud growth thesis. Option pricing based on Black-Scholes along a specified price path; market share from industry estimates. Source: company filings, options market data.
The regulatory cycle has reversed, not entrenched. The opposition's "permanent regulatory entrapment" argument (μScore 0.40) was the most compelling of their claims, but it collapsed under factual scrutiny. The HFCAA delisting threat — the centerpiece of the US dimension — is resolved: PCAOB has completed annual inspections of Chinese audit firms since 2022 with full access. On the Chinese side, the policy vector has shifted from suppression to encouragement, with Jack Ma's public rehabilitation at the November 2024 Xi symposium serving as the most visible signal. The Ant Group restructuring, cited as evidence of entrapment, actually resolved the stock's largest overhang by converting existential uncertainty into a known compliance framework.
Shareholder returns are creating a compounding valuation floor. Alibaba has returned over CNY 250 billion through buybacks and dividends across three fiscal years, reducing share count by 6.9% in FY2025 alone. At a P/E of 17.6x and P/B of 1.7x, every dollar of buyback is accretive — management is systematically arbitraging the gap between intrinsic value and market price. The dividend has nearly doubled in two years. With CNY 131.5 billion in cash and a 0.25x debt-to-equity [11] ratio, this program is sustainable and likely to accelerate.
E-commerce is stabilizing through AI-powered monetization, not collapsing. The opposition's "competitive erosion" narrative conflates market-share pressure with profit-pool destruction. Taobao and Tmall remain China's largest e-commerce profit engine. The 88VIP program (40M+ subscribers) creates a high-retention cohort that discount-driven competitors cannot replicate. The strategic pivot from GMV growth to monetization efficiency mirrors the transition Amazon made from 2014–2019 that unlocked its multi-year re-rating.
The bear case raised two arguments that deserve serious weight:
Operating income compression is real. The 64% year-over-year decline in operating income (μScore 0.27) cannot be dismissed. Even accounting for one-time items and investment losses, the trend reflects genuine margin pressure from competitive intensity in e-commerce and heavy AI infrastructure investment. The question is not whether margins are compressed today — they are — but whether this is cyclical (investment phase preceding margin expansion [25]) or structural (permanent profit-pool shrinkage). The evidence favors cyclical: cloud margins are improving, and e-commerce monetization efficiency is rising.
Competitive intensity is unrelenting. PDD's Temu and ByteDance's Douyin e-commerce have genuinely disrupted Alibaba's growth trajectory. The opposition correctly identified that market-share loss in lower-tier cities and among price-sensitive consumers is ongoing. However, this is a mature-industry reality, not an existential threat — Alibaba's moat [26] in brand commerce, logistics infrastructure (Cainiao), and merchant tools remains differentiated.
The debate has established a clear asymmetry. The TRUE side's strongest arguments — AI-cloud growth, regulatory reversal, and shareholder returns — are supported by recent, verifiable, directional evidence. The opposition's strongest arguments — margin compression [24] and competitive erosion — describe real headwinds but are backward-looking and conflated cyclical pressure with structural decline.
The option market provides an independent check: with ATM implied volatility around 46% and significant open interest at the 100–115 put strikes versus 130–140 call strikes, the market is pricing meaningful downside protection but also substantial upside potential. The skew does not suggest a market pricing in catastrophic outcomes — it suggests a market pricing in uncertainty with a positive expected return.
For a 5-year investor, the calculus is straightforward: you are buying China's dominant cloud-AI platform, its largest e-commerce profit engine, and a fortress balance sheet [17] — all at 17.6x earnings, with an accelerating buyback program shrinking your denominator, in a regulatory environment that has pivoted from suppression to encouragement. The risks are real but priced in; the upside catalysts are real and underpriced. That is the definition of a sound investment.
Round 3
Core claim: Alibaba remains a poor 5-year investment due to structural profit erosion, inescapable competitive displacement, and a regulatory environment that is cyclical but fundamentally unpredictable.
The FALSE side’s position rests on three pillars. First, Alibaba’s financial foundation is weakening, not strengthening. Despite claims of a "fortress balance sheet [17]," its core e-commerce [13] segment is suffering a catastrophic collapse in operating income—down 64% year-over-year [42]—driven by a brutal, low-margin price war with PDD and the loss of its social commerce frontier to ByteDance. This is not a temporary blip but a structural shift in its profit pool. Second, its much-touted cloud "escape velocity [15]" is an illusion. The 38% revenue growth is achieved while actively retreating from the public cloud market, resulting in a business that is a mere fraction the size of AWS or Azure, with AI revenue figures representing speculative run rates, not hard, recurring profit. Third, the regulatory risk, while perhaps not "permanent" in an absolute sense, is an inescapable feature of its operating environment. The Chinese state has demonstrated its willingness and ability to intervene decisively in the private sector, and the recent "thaw" is a policy choice that can be reversed just as quickly as it was enacted. The US delisting risk [12] may be in abeyance, but it is not extinct, and the geopolitical context ensures it remains a latent threat.
We acknowledge the strength of the TRUE side’s counter-arguments regarding the clear shift in China’s regulatory tone since 2023. The policy documents, Jack Ma’s rehabilitation, and the resolution of the Ant Group overhang are credible evidence of a genuine reversal in the government’s posture. Furthermore, Alibaba’s aggressive capital return program—over CNY 250 billion in buybacks and dividends over three years—is a powerful and tangible tailwind for shareholders that directly addresses past criticisms of capital misallocation.
However, these positive developments are ultimately overwhelmed by the fundamental deterioration in Alibaba’s competitive and financial position. A friendlier regulatory climate cannot restore a lost e-commerce moat [26] or magically scale a cloud business that is strategically retreating. The company is caught in a vice: it must spend heavily to compete in a low-margin core business, while its high-growth cloud engine is too small and too strategically compromised to offset this. For a 5-year investor, the combination of collapsing core profitability, a questionable cloud growth story, and a regulatory environment that remains subject to the whims of an authoritarian state presents an unacceptable risk profile that cannot be offset by even the most generous shareholder returns. The debate stands at an impasse on regulation, but the financial and competitive realities decisively undermine the bullish case.
The FALSE side contends that Alibaba Group Holding Limited is not a sound investment for a five-year holding horizon. The core thesis is that Alibaba is a deteriorating value trap: its headline valuation multiples appear cheap only because they are calculated against earnings that are collapsing in real time, its competitive positions across all core segments are eroding, and the regulatory environment — both domestic and international — remains a permanent structural overhang rather than a transient headwind.
This is the most concrete, verifiable argument on the FALSE side. Alibaba's operating income fell from CNY 140.9 billion in FY2025 to CNY 50.15 billion in FY2026 — a 64% year-over-year [42] decline. This is not a routine margin compression [24]; it represents a fundamental breakdown in enterprise-wide profitability. Revenue growth simultaneously decelerated to just 2.7% (CNY 996.3B to CNY 1,023.7B), barely keeping pace with nominal GDP. The bull case that FY2025's operating income represented normalized earnings is now demonstrably false. The FY2026 results reveal what the core business actually earns in a post-regulatory-reset, post-competitive-disruption environment, and that number is dramatically lower than what current valuation multiples imply.
The option market validates this concern. As of mid-June 2026, BABA is trading near $112, with the at-the-money implied volatility hovering around 46–52% — a level that signals persistent uncertainty. The put/call open interest skew is notably bearish: the 120-strike put holds over 15,000 contracts in open interest, the 125-strike put holds over 13,000, and the 130-strike put holds over 15,600. The deep in-the-money puts at 140 carry an implied volatility of 145.9%, reflecting the market pricing in a non-trivial probability of further significant downside. This is not the option surface of a stock that is "cheap and stabilizing."
| Strike | Put OI | Call OI | Put IV | Call IV |
|---|---|---|---|---|
| 110 | 6,616 | 1,598 | 46.4% | 46.4% |
| 115 | 8,310 | 5,448 | 50.3% | 49.3% |
| 120 | 15,061 | 9,847 | 54.2% | 52.2% |
| 125 | 13,235 | 6,519 | 67.8% | 46.4% |
| 130 | 15,623 | 19,673 | 110.8% | 61.0% |
| 140 | 6,913 | 32,503 | 145.9% | 88.3% |
Legend: BABA option chain open interest and implied volatility for near-the-money strikes, expiration June 18, 2026. Heavier put OI and elevated IV on out-of-the-money puts indicate market pricing of downside tail risk. Data sourced from market data as of June 16, 2026.
The TRUE side's highest-scored argument — that Alibaba Cloud's 38% revenue growth and US5.2B AI run rate represent "escape velocity" — collapses under scrutiny. Alibaba's FY2026 capital expenditures surged to approximately CNY 57 billion (US7.8 billion), more than double the prior year, overwhelmingly directed toward AI infrastructure. Yet the Cloud Intelligence Group's adjusted EBITA [1] for the same period was only CNY 6.1 billion. The segment consumed nearly 10x its "profit" in capital, delivering a deeply negative cash return on invested capital. Worse, adjusted EBITA is a non-GAAP measure that systematically excludes the very costs that make AI-cloud a capital-intensive, low-margin business.
The competitive dynamics are equally troubling. ByteDance's AI compute [8] spend in 2025 alone was estimated at approximately US8 billion — dwarfing Alibaba's entire cloud capex [5]. The price of AI inference in China has collapsed by over 80% in 18 months as ByteDance's Volcengine, Huawei Cloud, and Tencent Cloud race to the bottom. A 38% revenue growth rate purchased through price cuts is not escape velocity; it is a treadmill. Meanwhile, AWS alone generated US10.6 billion in quarterly operating income — more than Alibaba Cloud's entire annual EBITA — with 35–40% margins against Alibaba's single-digit margins. The Cloud segment contributed less than 6% of Alibaba's consolidated adjusted EBITA in FY2026. Even if it grows at 38% annually, compound arithmetic shows it cannot offset the commerce segment's CNY 90 billion operating income decline within a five-year horizon.
The TRUE side's claim that regulation is "easing" is wishful thinking. The Chinese regulatory framework that emerged from the 2020–2022 tech crackdown is now institutionalized, not transient. The State Administration for Market Regulation's antitrust guidelines, the Personal Information Protection Law, and the data security review regime are permanent fixtures. Alibaba's VIE (Variable Interest Entity) corporate structure — which US-listed shareholders rely upon — remains in a legally ambiguous state, subject to the whims of Chinese regulatory interpretation. The Holding Foreign Companies Accountable Act [18] (HFCAA) and ongoing US-China technology decoupling add a separate layer of delisting risk [12] that is not priced into a simple EV/EBITDA multiple. Even if the immediate delisting threat has been resolved through audit cooperation, the structural vulnerability of US-listed Chinese ADRs to geopolitical shocks remains. A five-year holding period is long enough for multiple regulatory cycles to inflict damage.
The TRUE side's argument that Alibaba has a "dominant moat [26]" is contradicted by the evidence. PDD Holdings and ByteDance (Douyin) have systematically captured share in Chinese e-commerce [13] through discount pricing and live-streaming commerce — formats where Alibaba's Taobao and Tmall have lagged consistently. Alibaba's 2.7% revenue growth in an economy growing at ~5% nominally implies ongoing market share losses. In international e-commerce, AliExpress and Lazada continue to burn capital against Amazon, Shopee, and Temu with no clear path to consolidated profitability. The restructuring into separate business units has exposed how dependent the entire ecosystem is on the declining core commerce engine.
The TRUE side's case is not without merit, and some of its arguments carry genuine weight:
AI-Cloud Growth Trajectory (μScore: 0.86): The 38% cloud revenue growth and US$5.2B AI annualized run rate [2] are genuinely impressive top-line numbers. Alibaba Cloud's 35.8% domestic market share is real, and the 57% adjusted EBITA growth demonstrates operating leverage [21]. The FALSE side must concede that if Alibaba Cloud can sustain mid-30% growth while improving margins to the mid-teens, it would eventually become a meaningful profit contributor. The question is whether this can happen within the five-year holding horizon, and whether the capital consumed to get there destroys shareholder value along the way.
Market Share Dominance (μScore: 0.73): Alibaba's 35.8% cloud market share, more than double the next competitor, is a genuine competitive advantage. Incumbency in enterprise cloud is sticky, and Alibaba's integration across e-commerce, logistics, and financial services creates cross-selling opportunities that pure-play competitors cannot replicate. The FALSE side acknowledges this moat exists but argues it is narrowing, not widening.
Apparent Valuation Cheapness (μScore: 0.44): On a trailing basis, Alibaba does trade at multiples that appear cheap relative to US tech peers. The company's ~US$50 billion net cash position provides a genuine margin of safety, and the aggressive share buyback program (which reduced share count meaningfully) does create per-share value. The FALSE side's counter is that these multiples are misleading because the "E" in P/E is collapsing, and the "EBITDA" in EV/EBITDA is being inflated by non-recurring items.
The debate turns on one central question: Is FY2026's 64% operating income decline a one-time reset from which Alibaba will recover, or is it the new normal reflecting permanent structural impairment?
The FALSE side has the stronger case on the evidence presented. The magnitude of the operating income collapse — CNY 50.15 billion, down from CNY 140.9 billion — is too large to dismiss as a transitory adjustment. The TRUE side's best argument (cloud escape velocity) is a top-line growth story that has not yet translated into consolidated earnings power sufficient to offset the commerce decline. The option market's heavy put skew and elevated implied volatility confirm that professional investors are pricing in continued uncertainty, not a recovery.
However, the debate is not one-sided. If Alibaba's operating income recovers to even CNY 80–90 billion in FY2027 — a plausible scenario if the FY2026 impairment and restructuring charges are non-recurring — the current valuation would indeed look cheap. The cloud segment, if it can sustain 30%+ growth and expand margins to 10–15%, could contribute meaningfully to consolidated earnings by FY2028–2029. The FALSE side's bear case requires the operating income decline to be structural; if it proves cyclical, the TRUE side wins.
On balance, the FALSE side has presented the more compelling case for the specific claim under evaluation. A five-year holding horizon is long enough for structural problems to compound and short enough that a cloud segment contributing single-digit percentages of consolidated profit cannot rescue the enterprise. The weight of the evidence — collapsing operating income, negative cash returns on cloud capex, competitive erosion across all segments, and a regulatory environment that is institutionalized rather than easing — supports the conclusion that Alibaba is not a sound investment for a five-year holding period. The apparent valuation discount is not an arbitrage opportunity; it is a rational discount reflecting the reality that Alibaba's best years of profitable growth are behind it.
Alibaba Group does not represent a sound 5-year investment. The combination of (a) structural erosion in the dominant core-commerce segment, (b) a sub-scale, capex [5]-hungry cloud business that is being mis-marketed as a "growth engine," and (c) unresolved geopolitical, regulatory, and delisting overhangs produces a negative expected return even from a depressed starting valuation. The market is correctly pricing significant tail risk, and the option chain data confirms this: BABA implied volatility of ~45% is roughly 2x the SPX, and a 70-strike put for June 2026 is bid at only 0.12 but mark-to-models at $7+ along any plausible downside scenario, demonstrating the asymmetric downside the market is already paying to hedge.
| Segment | FY25 Revenue (RMB B) | FY25 EBITA (RMB B) | EBITA Margin | Share of Group EBITA |
|---|---|---|---|---|
| Taobao & Tmall Group | ~445 | 165.0 | ~37% | ~95% |
| Cloud Intelligence Group | ~117 | 10.5 | ~9% | ~6% |
| International Digital Commerce | ~115 | -14.9 | -13% | -8% |
| Cainiao / Local Services / Others | ~80+ | ~13 | n/m | ~7% |
Legend: Alibaba FY2025 (ending March 2025) segment economics. Cloud is ~9% of revenue, ~7% of group EBITA, and the only segment with margin expansion [25] — yet it is also the most capex-intensive. Taobao & Tmall remains the structural cash engine. Source: Alibaba FY2025 20-F segment disclosure.
Argument A — Core commerce is in structural decline, not cyclical retreat. Taobao & Tmall Group EBITA fell 3% YoY in FY25, a stunning admission that the segment once growing 20%+ is now losing incremental profit dollars while revenue grows only mid-single digits. The competitive pressure from PDD (Pinduoduo/Temu) in price-sensitive tier-2/3 cities and from ByteDance's Douyin in livestreamed commerce has converted Alibaba's market-share lead into a margin-share giveaway. This single segment still funds roughly 95% of group EBITA, so any structural decline in its monetization is the dominant valuation driver for the next 5 years.
Argument B — Cloud "escape velocity [15]" is a rebrand, not a thesis. Cloud Intelligence Group is ~9% of revenue and ~7% of EBITA, yet management is committing ~RMB 127B/year (~100% of cloud revenue, ~9% of group revenue) to AI capex. This explains the 38% YoY collapse in free cash flow to RMB 73.8B in FY25. The "$5.2B annualized AI run rate" is a forward-looking disclosure off a near-zero base, and the segment is structurally constrained by U.S. semiconductor export controls that limit access to frontier GPUs. AWS took 8-10 years to reach the operating margin Alibaba Cloud now claims; Alibaba Cloud will take longer and start with smaller scale.
Argument C — Geopolitical/regulatory tail risk is binary and unpriced. BABA remains on the DoD 1260H list; HFCAA/PCAOB inspection risk persists; the founder's Ant Group remains under restructuring; and a 5-year holding period spans 2+ U.S. presidential cycles. Forced delisting would trigger mechanical selling by U.S. index funds, mutual funds, and pensions — not a multiple compression, but a liquidity event. This is not a tail to be ignored; it is a tail that has already bitten once (2021 drawdown of ~75% from peak).
Argument D — Margin trajectory is volatile, not "recovered." Reported FY25 operating income of RMB 140.9B is up 27% from FY24 — but only because FY24 was a deliberate, depressed base after the Ant IPO cancellation, massive antitrust fine [3], and RMB 17.5B impairment. A 27% bounce from a strategic-impairment base is not evidence of a new margin plateau; it is a partial mean-reversion. The 5-year forward earnings stream is far less stable than headline FY25 print suggests.
The TRUE side's strongest counter — and the highest-μScore argument in the entire debate at 0.86 — is the "AI-cloud engine reaching escape velocity" thesis that Alibaba Cloud grew 38% YoY with 40% external-customer growth and is now EBITA-profitable. This deserves honest engagement:
What the TRUE side got right: Alibaba Cloud is growing faster than AWS, Azure, or GCP did at comparable revenue scale, and the Q4 FY25 sequential print of 13% growth (annualized ~50%+) is genuinely strong. The Qwen model family is competitive with leading Chinese open-weight models, and Alibaba's full-stack offering (chips-via-UNIQUEPNP, models, cloud) is differentiated versus pure-play model labs. On a 5-year horizon, even skeptics should concede a non-trivial probability that Cloud Intelligence becomes a RMB 300B+ revenue, 20%+ EBITA margin business — which would meaningfully rerate the equity.
What the FALSE side's rebuttal established: However, the base effect is doing enormous work. From a RMB 50B revenue base in FY21, doubling revenue takes much less than from a RMB 117B base in FY25. The capex commitment (RMB 380B over 3 years) is greater than cumulative cloud EBITA over the same period under any plausible scenario, meaning the segment is structurally value-destroying in the near term, and value-neutral in the medium term even under the bull case. The "escape velocity" framing conflates revenue growth with free-cash-flow generation — a category error that has destroyed capital in prior cloud cycles (Snowflake pre-2022, most infrastructure SPACs).
Where the TRUE side is most vulnerable: The "cheap valuation, fortress balance sheet [17]" argument (μScore 0.44 — relatively weak) implicitly assumes that valuation is a sufficient signal. A stock trading at 1.7x P/B and 13x EV/EBITDA can be cheap on every historical metric and still be a 5-year value trap if the underlying earnings stream is itself compressing — which is exactly the risk in core commerce. Cheapness is necessary but not sufficient when the principal profit pool is contracting.
Where the FALSE side has the stronger hand:
- ■The structural-decline-in-core-commerce argument is supported by management's own segment disclosures (TTM [40] EBITA -3% YoY) and is not effectively rebutted by the TRUE side's evidence package. This is the single largest hole in the bull thesis.
- ■The capex-to-FCF mismatch is mathematically robust: RMB 380B AI commitment / 3 years = ~53B, versus FY25 FCF of 10B — even with full buyback suspension and dividend cuts, financing this from internal cash alone requires multi-year compression of capital returns.
- ■The geopolitical tail is unhedgable in a 5-year holding period.
Where the TRUE side has the stronger hand:
- ■The Cloud "escape velocity" data is the single most powerful evidence point, with a μScore of 0.86 — the highest in the debate. The FALSE side's rebuttal was effective in constraining the bull case, but did not destroy it.
- ■Valuation discipline: at 1.7x P/B, ~13x EV/EBITDA, with ~$50B+ in net cash and treasury, downside is partially anchored. The 5-year floor case (asset break-up value, Hong Kong listing, domestic re-rating) provides a meaningful margin of safety.
- ■Management's capital-return policy (multi-year buyback authorizations exceeding $20B cumulatively) signals confidence from insiders and reduces share count.
Net assessment: The debate, taken as a whole, leans negatively for a 5-year investment thesis but does not deliver a high-confidence short. The core-commerce decline is the most underappreciated risk; the cloud growth story is the most underappreciated opportunity. The 5-year expected return likely lies in the low-to-mid single digits, dominated by capital returns rather than multiple expansion or organic earnings growth — a profile that is insufficient to justify the binary geopolitical tail risk for most investors with a 5-year horizon. A fair verdict: not a sound investment on a risk-adjusted basis, despite cheap entry multiples, with the qualifier that a 10-year horizon, a value-tilted mandate, or a willingness to accept Hong Kong-only listing risk could change the calculus materially.
| Debate | TRUE Model | FALSE Model | TRUE Avg μ | FALSE Avg μ | TRUE Tokens | FALSE Tokens | Winner | Verdict | Conf. |
|---|---|---|---|---|---|---|---|---|---|
| #1 | anthropic/claude-opus-4.8 | deepseek/deepseek-v4-pro | 0.531 | 0.240 | 360 | 21 | TRUE | TRUE | 73% |
| #2 | z-ai/glm-5.1 | deepseek/deepseek-v4-pro | 0.000 | 0.000 | 54 | 21 | TRUE | TRUE | 67% |
| #3 | anthropic/claude-opus-4.8 | minimax/minimax-m3 | 0.000 | 0.000 | 360 | 18 | TRUE | FALSE | 62% |
| #4 | z-ai/glm-5.1 | minimax/minimax-m3 | 0.000 | 0.000 | 54 | 18 | TRUE | TRUE | 61% |
| #5 | anthropic/claude-opus-4.8 | qwen/qwen3-max | 0.000 | 0.000 | 360 | 57 | TRUE | TRUE | 71% |
| #6 | z-ai/glm-5.1 | qwen/qwen3-max | 0.000 | 0.000 | 54 | 57 | TRUE | TRUE | 67% |
| #7 | openai/gpt-5.5-pro | deepseek/deepseek-v4-pro | 0.000 | 0.000 | 2,430 | 21 | TRUE | TRUE | 60% |
| #8 | openai/gpt-5.5-pro | minimax/minimax-m3 | 0.000 | 0.000 | 2,430 | 18 | TRUE | TRUE | 58% |
| #9 | openai/gpt-5.5-pro | qwen/qwen3-max | 0.000 | 0.000 | 2,430 | 57 | TRUE | FALSE | 62% |
The following technical terms, abbreviations, and domain-specific concepts are referenced throughout this debate transcript. Numbers in square brackets [N] in the text above link to the corresponding entry below.
[1] adjusted EBITA — adjusted Earnings Before Interest, Taxes, and Amortization — A profitability metric that excludes interest, taxes, and amortization, along with certain non-recurring or non-cash items, used to assess operating performance.
[2] annualized run rate — A projection of financial performance over a full year based on extrapolating data from a shorter period, such as a single quarter.
[3] antitrust fine — A monetary penalty imposed by regulators for violating competition laws, such as anti-monopoly regulations.
[4] Beta — Beta coefficient — A measure of a stock's volatility relative to the overall market; a beta below 1.0 indicates lower volatility than the market.
[5] capex — capital expenditure — Funds used by a company to acquire, upgrade, or maintain physical assets such as infrastructure, property, or equipment.
[6] Cash per share — A company's total cash and cash equivalents divided by its number of outstanding shares, indicating liquidity on a per-share basis.
[7] cloud computing — The delivery of computing services such as servers, storage, and software over the internet, often on a subscription or usage basis.
[8] compute — computing power/compute — Processing capacity, especially for AI workloads, that companies monetize by renting out via cloud infrastructure.
[9] consensus analyst target price — The average price forecast for a stock derived from multiple analysts' projections over a given time horizon.
[10] customer management revenue — Revenue earned by Alibaba from merchant marketing and commission services on its e-commerce platforms.
[11] Debt-to-equity — debt-to-equity ratio — A leverage ratio comparing a company's total debt to its shareholder equity, indicating financial risk.
[12] delisting risk — The risk that a company's shares are removed from a stock exchange, often due to regulatory non-compliance or geopolitical factors.
[13] e-commerce — electronic commerce — The buying and selling of goods and services over the internet through online marketplaces and platforms.
[14] Enterprise Value / EBITDA — Enterprise Value to Earnings Before Interest, Taxes, Depreciation, and Amortization — A valuation multiple comparing a company's total enterprise value to its operating earnings, used to assess relative value independent of capital structure.
[15] escape velocity — A figurative term for when a business reaches self-sustaining, accelerating growth that no longer requires constant external support.
[16] fiscal year — fiscal year (FY) — A one-year accounting period a company uses for financial reporting, which may not align with the calendar year.
[17] fortress balance sheet — A financial position characterized by strong cash reserves and low debt, providing resilience against downturns.
[18] Holding Foreign Companies Accountable Act — Holding Foreign Companies Accountable Act (HFCAA) — A US law allowing delisting of foreign companies whose auditors cannot be inspected by US regulators for three consecutive years.
[19] hyperscale — Refers to large-scale cloud computing infrastructure capable of scaling massively to meet high demand.
[20] interest coverage — interest coverage ratio — A measure of a company's ability to pay interest on its outstanding debt, calculated as earnings divided by interest expense.
[21] leverage — financial leverage — The use of borrowed capital to finance operations; lower leverage indicates less reliance on debt.
[22] like-for-like basis — A comparison that excludes the effects of acquisitions, divestitures, or other one-off changes to measure organic performance.
[23] MaaS — Model-as-a-Service — A cloud offering that provides AI models to customers on demand, typically via APIs and subscription.
[24] margin compression — A reduction in profit margins, often due to rising costs or competitive pricing pressures.
[25] margin expansion — An increase in profit margins, typically as revenue grows faster than costs.
[26] moat — economic moat — A sustainable competitive advantage that protects a company from competitors, such as scale, brand, or network effects.
[27] monetization engine — The core mechanism by which a company generates revenue from its products, users, or platform activity.
[28] Net Income Attributable to Parent — The portion of net income belonging to the parent company's shareholders, excluding minority/non-controlling interests.
[29] optionality — The value derived from potential future opportunities or choices that a company or investment may exercise.
[30] Price / Book — Price to Book ratio — A valuation ratio comparing a company's market price to its book value (net asset value) per share.
[31] Price / Earnings — Price to Earnings ratio — A valuation ratio comparing a company's share price to its earnings per share, indicating how much investors pay per unit of earnings.
[32] Price / Sales — Price to Sales ratio — A valuation ratio comparing a company's market capitalization to its total revenue.
[33] quick commerce — A retail model offering rapid delivery of goods, typically within minutes to an hour, often for groceries and essentials.
[34] risk premium — The additional return investors require to compensate for taking on higher risk relative to a risk-free alternative.
[35] risk-reward profile — An assessment of the potential gains of an investment relative to its potential losses or risks.
[36] SEC 20-F — Securities and Exchange Commission Form 20-F — An annual report filed with the US SEC by foreign private issuers, providing audited financial statements and disclosures.
[37] secular margin compression — A long-term, structural decline in profit margins driven by persistent rather than temporary or cyclical factors.
[38] SOE — State-Owned Enterprise — A business entity owned or controlled by a government, often receiving preferential treatment in procurement and contracts.
[39] sum of parts — sum-of-the-parts valuation — A valuation method that values each business segment separately and adds them together to determine total company value.
[40] TTM — Trailing Twelve Months — A measurement of financial performance over the most recent twelve consecutive months.
[41] VIE structure — Variable Interest Entity structure — A legal arrangement used by Chinese companies to allow foreign investment via contractual control rather than direct equity ownership, used to circumvent foreign ownership restrictions.
[42] year-over-year — year-over-year (YoY) — A comparison of a financial metric for one period against the same period in the previous year.
[43] yuan — Chinese yuan / Renminbi (RMB/CNY) — The official currency of China, used here to denominate Alibaba's financial figures.
The following financial data tables were referenced during the debate exchanges:
| Metric (TTM) | Value |
|---|---|
| Price / Earnings | 17.6x |
| Enterprise Value / EBITDA | 12.9x |
| Price / Sales | 1.7x |
| Price / Book | 1.7x |
| Cash per share | ~RMB 18.1 |
| Debt-to-equity | 0.25x |
| Interest coverage | 5.9x |
| Beta | 0.46 |
Legend: Alibaba (BABA) trailing-twelve-month valuation and balance-sheet ratios. Multiples in turns (x); cash per share in RMB. Low beta reflects defensive sensitivity vs. the broad market. Source: latest reported financials.
</FinancialData>
| Fiscal Year | Operating Income (CNY B) | Net Income (CNY B) | Op Income YoY Δ |
|---|---|---|---|
| FY2021 | 89.7 | 150.6 | — |
| FY2022 | 69.6 | 62.2 | -22.4% |
| FY2023 | 100.4 | 72.8 | +44.2% |
| FY2024 | 113.4 | 80.0 | +12.9% |
| FY2025 | 140.9 | 130.1 | +24.3% |
| FY2026 | 50.2 | 103.6 | -64.4% |
Legend: Alibaba Group annual operating income and net income (CNY billions), FY2021–FY2026, per SEC 20-F filings. FY2026 represents the fiscal year ending March 31, 2026. Net income is Net Income Attributable to Parent.
</FinancialData>
| Metric | BABA | US E-Commerce Peers | Discount |
|---|---|---|---|
| P/E (Trailing) | 17.6x | 25–35x | 30–50% |
| EV/EBITDA | 12.9x | 20–35x | 35–63% |
| Price/Book | 1.72x | 5–12x | 66–86% |
| PEG Ratio | 0.42 | 1.0–2.0 | 58–79% |
Legend: Valuation comparison of BABA vs. US e-commerce platform peers (AMZN, PDD ADRs, MELI). All ratios are trailing twelve months as of mid-2026. Discount column shows the percentage by which BABA trades below the peer range midpoint. Source: market data, company financials.
</FinancialData>
| Path Step | Stock Price | $150 Call Value |
|---|---|---|
| Start | $125 | $16.10 |
| Step 3 | $150 | $26.62 |
| Step 5 | $180 | $43.82 |
| Step 7 | $220 | $74.81 |
| Step 10 | $300 | $150.75 |
Legend: Black-Scholes call option values along a projected price recovery path for BABA, $150 strike, 365 days to expiry, implied volatility ~45.2%. Stock price and option value in USD. Source: options pricing model.
</FinancialData>
| Metric | Alibaba Cloud (FY2025) | AWS (2024) | Azure (est. 2024) |
|---|---|---|---|
| Revenue (US$B) | ~16.4 | 90.8 | ~75 |
| Operating Margin | 9.1% | 30.3% | ~44% |
| AI Revenue Share | ~21.5% of segment | ~15% | ~18% |
Legend: Revenue and margin comparison of major cloud providers. Alibaba Cloud data from FY2025 (ending Mar 2025) annual report; AWS and Azure from 2024 calendar year filings. AI revenue share estimated from segment disclosures. Sources: company filings.
</FinancialData>
| Year | Alibaba China E-Commerce GMV Share (est.) | PDD Share (est.) | Douyin/Kuaishou Share (est.) |
|---|---|---|---|
| 2018 | ~75% | ~5% | <3% |
| 2021 | ~53% | ~15% | ~9% |
| 2023 | ~45% | ~19% | ~15% |
| 2025 | ~44-46% | ~20% | ~17% |
Legend: Estimated GMV share of China e-commerce market by platform. Figures are consensus estimates compiled from third-party research and broker reports; Alibaba does not disclose precise GMV share. Source: industry analyst estimates, company disclosures.
</FinancialData>
| Metric | Value |
|---|---|
| Price / Earnings (TTM) | 17.6x |
| Price / Book | 1.7x |
| Price / Sales | 1.7x |
| EV / EBITDA multiple | 12.9x |
| Cash per share | ~CNY 18.1 |
| Book value per share | ~CNY 56.9 |
| Debt / Equity | 0.25 |
| Net profit margin (TTM) | 10.1% |
Legend: Alibaba (BABA) trailing-twelve-month valuation and balance-sheet ratios as of mid-2026. Cash and book values in CNY per share. Low leverage (D/E 0.25) and a large cash buffer underpin downside protection.
</FinancialData>
| Metric (RMB million, unless noted) | FY2024 | FY2025 | FY2026 | YoY % Change |
|---|---|---|---|---|
| Revenue | 941,168 | 996,347 | 1,023,670 | +3% |
| Net income attributable to ordinary shareholders | 71,332 | 125,976 | 102,127 | -19% |
| Non-GAAP net income | — | 158,122 | 60,658 | -62% |
| Adjusted EBITA | — | — | 76,416 | -56% |
| Net cash from operating activities | — | 163,509 | 76,213 | -53% |
| Free cash flow | — | 73,870 | (46,609) | N/A |
Legend: Alibaba Group Holding Limited fiscal-year results for the three years ended 31 March 2024–2026, in RMB millions (US$ values from the 20-F filing are shown in the body of the argument). Figures sourced from Alibaba's FY2026 annual results announcement (businesswire.com), 6-K filing summary (stocktitan.net), 20-F filing (last10k.com), and HKEX annual results announcement (hkexnews.hk).
</FinancialData>
| Alibaba metric (RMB million) | FY2024 | FY2025 | FY2026 | YoY % Change |
|---|---|---|---|---|
| Total group revenue | 941,168 | 996,347 | 1,023,670 | +3% |
| Cloud Intelligence Group revenue | ~117,022 | ~118,028 | 158,132 | +34% |
| Cloud share of group revenue | 12.4% | 11.8% | 15.4% | — |
| Net cash from operating activities | 182,174 | 163,509 | 76,213 | -53% |
| Free cash flow | 45,587 | 73,870 | (46,609) | N/A |
Legend: Alibaba Group revenue mix and cash-generation profile for the three fiscal years ended 31 March 2024–2026, in RMB millions. The table juxtaposes cloud-segment growth (real but off a small base) against group-level cash destruction, illustrating that the "AI-cloud engine" is being subsidized by the rest of the business. Sources: Alibaba FY2026 annual results (businesswire.com), 6-K filing (stocktitan.net), and HKEX annual results (hkexnews.hk).
</FinancialData>
| Metric | Current Price | Target Low | Consensus Target | Target High |
|---|---|---|---|---|
| BABA (USD) | 110.97 | 92.26 | 191.90 | 259.12 |
Legend: Alibaba (BABA) analyst price targets versus current price, mid-2026, 40 analysts, consensus rating "strong buy." Even the low target is near today's price, while the consensus implies ~73% upside. All values in USD.
</FinancialData>
| Metric (RMB million) | FY2024 | FY2025 | FY2026 | YoY % Change |
|---|---|---|---|---|
| Group revenue | 941,168 | 996,347 | 1,023,670 | +3% |
| Net income attributable to ordinary shareholders | 71,332 | 125,976 | 102,127 | -19% |
| Non-GAAP net income | — | 158,122 | 60,658 | -62% |
| Adjusted EBITA | — | — | 76,416 | -56% |
| Cloud Intelligence Group revenue | ~117,022 | ~118,028 | 158,132 | +34% |
| Cloud share of group revenue | 12.4% | 11.8% | 15.4% | — |
| Net cash from operating activities | 182,174 | 163,509 | 76,213 | -53% |
| Free cash flow | 45,587 | 73,870 | (46,609) | N/A |
Legend: Alibaba Group Holding Limited (BABA / 9988) audited fiscal-year results for the three years ended 31 March 2024–2026, in RMB millions. The table summarizes the FALSE side's case: top-line growth has slowed to 3%, profitability and cash generation have collapsed in FY2026, and the cloud segment — though genuinely growing — is still only ~15% of group revenue while group FCF is negative. Sources: Alibaba FY2026 annual results announcement (businesswire.com), 6-K filing summary (stocktitan.net), HKEX annual results announcement (hkexnews.hk), and 20-F filing (last10k.com).
</FinancialData>
| Fiscal Year | Buybacks (CNY B) | Dividends (CNY B) | Total Return (CNY B) | Share Count Δ |
|---|---|---|---|---|
| FY2024 | 88.7 | 0.0 | 88.7 | -3.8% |
| FY2025 | 86.7 | 29.3 | 116.0 | -6.9% |
| FY2026 | 7.6 | 33.7 | 41.3 | -1.2% |
Legend: Alibaba capital return program by fiscal year (ending March 31). Buybacks and dividends in CNY billions. Share count change is year-over-year decline in weighted average basic shares. FY2026 buyback figure reflects partial-year reporting. Source: company 20-F filings.
</FinancialData>
| Metric | Value | Note |
|---|---|---|
| Current Price (BABA, USD) | $110.97 | NYSE close |
| Analyst Target Median | $190.91 | 12-month consensus |
| Analyst Target High | $259.12 | Implied +133.5% |
| Analyst Target Low | $92.26 | Implied −16.9% |
| # of Analysts | 40 | Coverage breadth |
| Consensus Rating | Strong Buy | Mean recommendation 1.37 |
Legend: Sell-side consensus on BABA (NYSE) as of June 2026, illustrating the unusually wide target-price dispersion that signals fundamental uncertainty.
</FinancialData>
| Regulatory Event | Status | Resolution Date | Ongoing Impact |
|---|---|---|---|
| Antitrust fine (CNY 18.2B) | Paid in full | FY2022 | None — closed |
| Ant Group restructuring | Completed | July 2023 | Ant operates as financial holding co. |
| PCAOB audit access | Secured | Sept 2022 | Annual inspections compliant |
| Sun Art divestiture | Completed | FY2025 | No longer consolidated |
| Intime retail sale | Completed | FY2026 | Proceeds received |
| Platform economy support policy | Active | Dec 2022–present | Positive — pro-growth directive |
Legend: Key regulatory events affecting Alibaba, their resolution status, and whether they represent ongoing constraints. Source: company 20-F filings, PCAOB inspection reports, Central Economic Work Conference communiqués.
</FinancialData>
| Segment | Revenue (CNY B) | YoY Growth | Adj EBITA Margin | % of Group Revenue |
|---|---|---|---|---|
| Cloud Intelligence Group (FY2024) | 106.4 | +3% | +5.6% | ~10% |
| Cloud Intelligence Group (FY2025) | 118.0 | +11% | +8.4% | ~11% |
| Cloud Intelligence Group (FY2026) | 162.0 | +38% | +9.0% | ~14% |
| All Others / Cainiao / Freshippo | ~120 | low single digits | mixed | ~10% |
| Taobao/Tmall (Core CMR) | ~720 | +mid single | ~50% | ~65% |
Legend: Alibaba segment revenue and adjusted EBITA margins across fiscal years ending March 31. Cloud growth in FY2026 spiked from a deliberately-depressed FY2024-25 base following management's "quality of revenue" reorganization. Adjusted EBITA excludes stock-based compensation. Source: Alibaba 20-F and interim earnings filings (https://www.alibabagroup.com/en-US/ir-financial-reports).
</FinancialData>
| Metric | Value | Context |
|---|---|---|
| Cloud Revenue Growth (YoY) | +38% | FY2026 reported |
| China AI Cloud Market Share | 35.8% | More than double #2 |
| $150 Call Premium (1-yr) | $18.55 | At-the-money+ |
| $150 Call Value at $225 Path | $75.63 | 4x option return |
| Implied Volatility | 45.2% | Priced for stagnation |
Legend: Key metrics for Alibaba's AI-cloud business and option market pricing. Cloud market share per industry reports; option data from current chain with Black-Scholes path valuation. Source: company filings, options market data.
</FinancialData>
| Fiscal Year | Buybacks | Dividends Paid | Total Returned |
|---|---|---|---|
| FY2024 | 89.4 | 18.1 | 107.5 |
| FY2025 | 87.4 | 29.3 | 116.7 |
| FY2026 | 7.6 | 33.7 | 41.3 |
Legend: Alibaba capital returned to shareholders, in CNY billions, FY2024–FY2026 (fiscal year ending March 31). Source: company cash flow statements. The FY2026 buyback pause coincides with a record capex reinvestment cycle.
</FinancialData>
| Fiscal Year | Capex | Operating Cash Flow | Net Income |
|---|---|---|---|
| FY2024 | 33.2 | 184.0 | 80.4 |
| FY2025 | 86.7 | 164.8 | 130.5 |
| FY2026 | 126.9 | 76.2 | 102.1 |
Legend: Alibaba capex vs. operating cash flow and net income, CNY billions, FY2024–FY2026. The capex ramp — not margin erosion — explains the near-term cash-flow compression. Source: company financials.
</FinancialData>
| Regulatory Item | Bear Framing | Actual Status |
|---|---|---|
| Antitrust fine (CNY 18.2B) | Ongoing threat | One-time, paid 2021, absorbed |
| Platform "rectification" | Permanent crackdown | Officially concluded Aug 2022 |
| Ant Group restructuring | Structural overhang | Resolved; re-licensed, value catalyst |
| PCAOB / HFCAA delisting | Imminent risk | Inspection access granted Dec 2022 |
| US ADR dependence | Capital-impairment channel | Neutralized by HK primary listing (2024) |
Legend: Bear-case regulatory claims versus their documented resolution status. Sources: SEC/PCAOB statements, China SAMR announcements, HKEX listing records. Each cited item is closed or materially de-risked, undermining the "permanent entrapment" framing.
</FinancialData>
| Fiscal Year | Share Buybacks (CNY B) | Dividends (CNY B) | Total Return (CNY B) | YoY Growth |
|---|---|---|---|---|
| FY2024 | 88.7 | 17.9 | 106.6 | — |
| FY2025 | 86.7 | 29.1 | 115.8 | +8.6% |
| FY2026 | 7.6* | 33.7 | 41.3* | — |
*Legend: Alibaba shareholder returns by fiscal year (ending March 31). FY2026 buyback figure reflects partial-year filing; full-year authorization remains in place. Amounts in CNY billions. Source: SEC 20-F filings.
</FinancialData> The cumulative buyback of approximately CNY 252 billion over three years has reduced weighted average basic shares outstanding by 6.9% in FY2025 alone, with the pace accelerating. The dividend — initiated only in FY2024 — has nearly doubled in two years to CNY 33.7 billion, yielding approximately 0.9% on the ADR. With
| Metric | Value | Context |
|---|---|---|
| Cloud Revenue Growth (YoY) | +38% | Most recent quarter |
| China AI Cloud Market Share | 35.8% | More than double #2 |
| $180 Call Option (1yr) | ~$11 → ~$33 | Along $130→$210 path |
| Implied Volatility (ATM) | ~46% | Moderate for a large-cap |
Legend: Key metrics supporting Alibaba's AI-cloud growth thesis. Option pricing based on Black-Scholes along a specified price path; market share from industry estimates. Source: company filings, options market data.
</FinancialData>
| Metric (CNY Billions) | FY2022 | FY2023 | FY2024 | FY2025 | FY2026 | FY25→FY26 Δ |
|---|---|---|---|---|---|---|
| Revenue | 853.1 | 868.7 | 941.2 | 996.3 | 1,023.7 | +2.7% |
| Operating Income | 69.6 | 100.4 | 113.4 | 140.9 | 50.2 | −64.4% |
| Net Income | 62.2 | 72.8 | 80.0 | 130.1 | 103.6 | −20.4% |
Legend: Alibaba Group key financial metrics FY2022–FY2026 (fiscal years ending March 31). All figures in CNY billions. Operating income data sourced from SEC 20-F filings (CIK 1577552). FY2026 data from the May 2026 20-F filing.
</FinancialData>
| Metric | FY2024 | FY2025 | FY2026 | Change |
|---|---|---|---|---|
| Revenue | RMB 941.2B | RMB 996.3B | RMB 1,023.7B | +8.8% |
| Net income | RMB 71.3B | RMB 126.0B | RMB 102.1B | +43.2% |
Legend: Alibaba reported consolidated results for fiscal years ended March 31. Figures are in RMB billions; change compares FY2026 with FY2024. Source: company annual reporting.
</FinancialData>
| Market reference | Value |
|---|---|
| Recent BABA price | $110.97 |
| Consensus target | $191.90 |
| Median target | $190.91 |
| High target | $259.12 |
| Low target | $92.26 |
| Analyst count | 40 |
| Consensus recommendation | Strong Buy |
Legend: Market consensus snapshot for Alibaba’s NYSE-listed shares. Prices and targets are in USD per ADS; recommendation reflects aggregated analyst views.
</FinancialData>
| Expiration | Strike | Call bid | Call ask | Put bid | Put ask | Open interest |
|---|---|---|---|---|---|---|
| 2026-06-18 | $110 | $3.30 | $3.60 | $0.81 | $0.90 | 1,598 calls / 6,616 puts |
| 2026-06-18 | $115 | $1.00 | $1.06 | $3.25 | $3.70 | 5,448 calls / 8,310 puts |
| 2026-06-18 | $120 | $0.22 | $0.24 | $7.45 | $7.90 | 9,847 calls / 15,061 puts |
Legend: Selected near-the-money listed option quotes for Alibaba ADS. Bid and ask are in USD per option share; open interest is contract count.
</FinancialData>
| BABA price scenario | Modeled 1-year $120 call value |
|---|---|
| $113 | $19.75 |
| $125 | $23.75 |
| $140 | $30.28 |
| $160 | $42.82 |
Legend: Illustrative Black-Scholes valuation path for a BABA call option with a $120 strike and one year to expiry, using implied volatility of 45.2%. Values are in USD per option share.
</FinancialData>
| Strike | Put OI | Call OI | Put IV | Call IV |
|---|---|---|---|---|
| 110 | 6,616 | 1,598 | 46.4% | 46.4% |
| 115 | 8,310 | 5,448 | 50.3% | 49.3% |
| 120 | 15,061 | 9,847 | 54.2% | 52.2% |
| 125 | 13,235 | 6,519 | 67.8% | 46.4% |
| 130 | 15,623 | 19,673 | 110.8% | 61.0% |
| 140 | 6,913 | 32,503 | 145.9% | 88.3% |
Legend: BABA option chain open interest and implied volatility for near-the-money strikes, expiration June 18, 2026. Heavier put OI and elevated IV on out-of-the-money puts indicate market pricing of downside tail risk. Data sourced from market data as of June 16, 2026.
</FinancialData>
| Metric (FY ending March 2025) | Value | YoY Change |
|---|---|---|
| Revenue | RMB 996.35B | +6% |
| Operating income | RMB 140.9B | +27% (recovery from FY24 base) |
| Net income (adj.) | RMB 158.1B | +13% |
| Taobao & TGM Group EBITA | RMB 165.0B | -3% (segment decline) |
| Cloud Intelligence EBITA | RMB 10.5B | +225% (off small base) |
| International Digital Commerce EBITA | -RMB 14.9B | Loss widened |
| Free cash flow | RMB 73.8B | -38% YoY |
Legend: Alibaba Group fiscal year ending March 2025 results. All figures in RMB billions. Source: Alibaba FY2025 annual report (20-F filing).
</FinancialData>
| Segment | FY25 Revenue (RMB B) | FY25 EBITA (RMB B) | EBITA Margin | Share of Group EBITA |
|---|---|---|---|---|
| Taobao & Tmall Group | ~445 | 165.0 | ~37% | ~95% |
| Cloud Intelligence Group | ~117 | 10.5 | ~9% | ~6% |
| International Digital Commerce | ~115 | -14.9 | -13% | -8% |
| Cainiao / Local Services / Others | ~80+ | ~13 | n/m | ~7% |
Legend: Alibaba FY2025 (ending March 2025) segment economics. Cloud is ~9% of revenue, ~7% of group EBITA, and the only segment with margin expansion — yet it is also the most capex-intensive. Taobao & Tmall remains the structural cash engine. Source: Alibaba FY2025 20-F segment disclosure.
</FinancialData>
| Company | China E-commerce YoY Revenue Growth (Q1 2025) | GMV Trend |
|---|---|---|
| Alibaba | +4% | Declining share |
| PDD Holdings | +84% | Overtaking Taobao |
| JD.com | +9% | Stable |
Legend: Recent e-commerce growth metrics in China. Alibaba lags far behind peers, indicating competitive erosion. Source: company earnings reports.
</FinancialData>
The debaters consulted the following Solsice slash-command tools (/GLOBALREPORT, /ECO, /TECHNICALS, …) — exposed as first-class MCP tools. Each block below is the raw output retrieved during the debate.
MCP tool: get_option_chain
| Type | Strike | Expiration | Bid | Ask | Last | IV | Vol | OI |
|---|---|---|---|---|---|---|---|---|
| CALL | 30 | 2026-06-18 | 81.95 | 83.2 | 82.2 | 522.5% | - | 1 |
| PUT | 30 | 2026-06-18 | - | 0.01 | - | 488.3% | - | 1 |
| CALL | 35 | 2026-06-18 | 76.95 | 79.1 | 80.7 | 694.2% | - | - |
| PUT | 35 | 2026-06-18 | - | 0.25 | - | 432.7% | - | 2 |
| CALL | 40 | 2026-06-18 | 71.4 | 74.4 | - | 585.9% | - | - |
| PUT | 40 | 2026-06-18 | - | 1.95 | - | 384.9% | - | 3 |
| CALL | 45 | 2026-06-18 | 66.95 | 69.15 | - | 558.5% | - | - |
| PUT | 45 | 2026-06-18 | - | 1.82 | - | 342.9% | - | 2 |
| CALL | 50 | 2026-06-18 | 61.85 | 64.35 | 65.7 | 508.8% | - | - |
| PUT | 50 | 2026-06-18 | - | 0.02 | - | 305.9% | - | 46 |
| CALL | 55 | 2026-06-18 | 56.5 | 59.4 | 60.7 | 428.8% | - | - |
| PUT | 55 | 2026-06-18 | - | 0.03 | - | 271.7% | - | 10 |
| CALL | 60 | 2026-06-18 | 51.5 | 53.75 | 55.69 | 285.4% | - | - |
| PUT | 60 | 2026-06-18 | - | 0.05 | - | 240.5% | - | 80 |
| CALL | 65 | 2026-06-18 | 46.55 | 48.8 | 50.7 | 274.7% | - | - |
| PUT | 65 | 2026-06-18 | - | 0.08 | - | 211.2% | - | 70 |
| CALL | 70 | 2026-06-18 | 41.5 | 43.8 | 45.7 | 232.7% | - | 2 |
| PUT | 70 | 2026-06-18 | - | 0.12 | - | 184.9% | - | 109 |
| CALL | 75 | 2026-06-18 | 36.45 | 38.8 | 36.24 | 189.8% | - | 2 |
| PUT | 75 | 2026-06-18 | - | 0.33 | 0.01 | 159.5% | 5 | 139 |
| CALL | 80 | 2026-06-18 | 31.55 | 34.35 | 36.35 | 224.9% | - | 1 |
| PUT | 80 | 2026-06-18 | - | 0.05 | - | 136.1% | - | 1114 |
| CALL | 85 | 2026-06-18 | 26.4 | 28.8 | 31.8 | 125.4% | - | - |
| PUT | 85 | 2026-06-18 | - | 0.1 | 0.01 | 113.7% | 2 | 5680 |
| CALL | 90 | 2026-06-18 | 22.1 | 23.7 | 22.44 | 153.7% | - | 23 |
| PUT | 90 | 2026-06-18 | - | 0.01 | 0.01 | 92.2% | 47 | 1742 |
| CALL | 95 | 2026-06-18 | 17.1 | 18.7 | 21.75 | 123.4% | - | 3 |
| PUT | 95 | 2026-06-18 | 0.01 | 0.05 | 0.03 | 82.5% | 648 | 3091 |
| CALL | 100 | 2026-06-18 | 12.3 | 12.9 | 12.45 | 57.1% | 3 | 143 |
| PUT | 100 | 2026-06-18 | 0.03 | 0.1 | 0.05 | 67.8% | 174 | 7819 |
| CALL | 101 | 2026-06-18 | 11.1 | 12.1 | - | 52.2% | - | - |
| PUT | 101 | 2026-06-18 | - | 0.11 | 0.04 | 48.3% | 523 | 2 |
| CALL | 102 | 2026-06-18 | 10.15 | 11.9 | - | 88.3% | - | - |
| PUT | 102 | 2026-06-18 | - | 0.1 | 0.08 | 44.4% | 48 | 42 |
| CALL | 103 | 2026-06-18 | 9.2 | 10.55 | - | 73.7% | - | - |
| PUT | 103 | 2026-06-18 | 0.01 | 0.16 | 0.09 | 56.1% | 36 | 284 |
| CALL | 104 | 2026-06-18 | 8.05 | 9.55 | 9.36 | 62.0% | 3 | 1 |
| PUT | 104 | 2026-06-18 | 0.09 | 0.16 | 0.12 | 54.2% | 55 | 136 |
| CALL | 105 | 2026-06-18 | 6.85 | 8.25 | 7.73 | 1.5% | 5 | 161 |
| PUT | 105 | 2026-06-18 | 0.15 | 0.17 | 0.17 | 52.2% | 1439 | 2079 |
| CALL | 106 | 2026-06-18 | 6.3 | 7.35 | 6.83 | 51.2% | 5 | 7 |
| PUT | 106 | 2026-06-18 | 0.19 | 0.25 | 0.25 | 50.3% | 253 | 198 |
| CALL | 107 | 2026-06-18 | 5.55 | 6.5 | 5.6 | 55.1% | 71 | 8 |
| PUT | 107 | 2026-06-18 | 0.28 | 0.35 | 0.3 | 49.3% | 1249 | 284 |
| CALL | 108 | 2026-06-18 | 4.3 | 5.6 | 4.7 | 45.4% | 97 | 29 |
| PUT | 108 | 2026-06-18 | 0.37 | 0.49 | 0.47 | 47.3% | 339 | 1311 |
| CALL | 109 | 2026-06-18 | 4.0 | 4.35 | 3.9 | 46.4% | 30 | 14 |
| PUT | 109 | 2026-06-18 | 0.56 | 0.65 | 0.65 | 46.4% | 3202 | 1015 |
| CALL | 110 | 2026-06-18 | 3.3 | 3.6 | 3.4 | 46.4% | 294 | 1598 |
| PUT | 110 | 2026-06-18 | 0.81 | 0.9 | 0.85 | 46.4% | 1030 | 6616 |
| CALL | 111 | 2026-06-18 | 2.6 | 2.9 | 2.6 | 45.4% | 359 | 1043 |
| PUT | 111 | 2026-06-18 | 1.11 | 1.32 | 1.29 | 47.3% | 513 | 868 |
| CALL | 112 | 2026-06-18 | 2.08 | 2.31 | 2.14 | 46.4% | 853 | 751 |
| PUT | 112 | 2026-06-18 | 1.51 | 1.69 | 1.63 | 46.4% | 235 | 482 |
| CALL | 113 | 2026-06-18 | 1.62 | 1.74 | 1.73 | 46.4% | 1374 | 5262 |
| PUT | 113 | 2026-06-18 | 2.0 | 2.31 | 2.23 | 47.3% | 355 | 189 |
| CALL | 114 | 2026-06-18 | 1.24 | 1.4 | 1.32 | 47.3% | 1675 | 711 |
| PUT | 114 | 2026-06-18 | 2.56 | 3.05 | 2.52 | 49.3% | 31 | 327 |
| CALL | 115 | 2026-06-18 | 1.0 | 1.06 | 0.98 | 49.3% | 8609 | 5448 |
| PUT | 115 | 2026-06-18 | 3.25 | 3.7 | 3.5 | 50.3% | 565 | 8310 |
| CALL | 116 | 2026-06-18 | 0.7 | 0.82 | 0.74 | 49.3% | 1820 | 711 |
| PUT | 116 | 2026-06-18 | 3.8 | 4.55 | 4.37 | 49.3% | 30 | 102 |
| CALL | 117 | 2026-06-18 | 0.51 | 0.62 | 0.56 | 49.3% | 887 | 1083 |
| PUT | 117 | 2026-06-18 | 4.8 | 5.5 | 4.9 | 55.1% | 4 | 175 |
| CALL | 118 | 2026-06-18 | 0.38 | 0.44 | 0.41 | 50.3% | 2208 | 949 |
| PUT | 118 | 2026-06-18 | 5.2 | 6.55 | 5.8 | 52.2% | 55 | 62 |
| CALL | 119 | 2026-06-18 | 0.29 | 0.34 | 0.29 | 52.2% | 740 | 1542 |
| PUT | 119 | 2026-06-18 | 5.7 | 7.55 | 6.25 | 46.4% | 1 | 27 |
| CALL | 120 | 2026-06-18 | 0.22 | 0.24 | 0.23 | 52.2% | 5149 | 9847 |
| PUT | 120 | 2026-06-18 | 7.45 | 7.9 | 7.8 | 54.2% | 596 | 15061 |
| CALL | 121 | 2026-06-18 | 0.14 | 0.19 | 0.17 | 53.2% | 557 | 1251 |
| PUT | 121 | 2026-06-18 | 8.4 | 9.6 | 8.32 | 74.7% | 1 | 547 |
| CALL | 122 | 2026-06-18 | 0.13 | 0.15 | 0.14 | 56.1% | 346 | 1018 |
| PUT | 122 | 2026-06-18 | 8.55 | 10.5 | 9.11 | 53.2% | 1 | 265 |
| CALL | 123 | 2026-06-18 | 0.09 | 0.12 | 0.11 | 56.1% | 539 | 4414 |
| PUT | 123 | 2026-06-18 | 10.05 | 11.55 | 10.55 | 76.6% | 16 | 3179 |
| CALL | 124 | 2026-06-18 | 0.07 | 0.11 | 0.08 | 59.0% | 1104 | 447 |
| PUT | 124 | 2026-06-18 | 11.0 | 12.4 | 11.22 | 75.6% | 3 | 549 |
| CALL | 125 | 2026-06-18 | - | 0.08 | 0.06 | 46.4% | 1797 | 6519 |
| PUT | 125 | 2026-06-18 | 12.3 | 12.8 | 12.7 | 67.8% | 232 | 13235 |
| CALL | 126 | 2026-06-18 | 0.04 | 0.07 | 0.06 | 62.9% | 55 | 391 |
| PUT | 126 | 2026-06-18 | 12.95 | 14.5 | 13.22 | 86.4% | 13 | 289 |
| CALL | 127 | 2026-06-18 | 0.03 | 0.08 | 0.05 | 65.9% | 33 | 1960 |
| PUT | 127 | 2026-06-18 | 14.1 | 15.0 | 13.91 | 76.6% | 10 | 204 |
| CALL | 128 | 2026-06-18 | 0.04 | 0.06 | 0.05 | 67.8% | 78 | 231 |
| PUT | 128 | 2026-06-18 | 14.85 | 16.55 | 15.75 | 93.2% | 48 | 455 |
| CALL | 129 | 2026-06-18 | - | 0.06 | 0.06 | 58.1% | 229 | 1681 |
| PUT | 129 | 2026-06-18 | 15.8 | 17.6 | 16.64 | 98.1% | 20 | 260 |
| CALL | 130 | 2026-06-18 | - | 0.04 | 0.04 | 61.0% | 655 | 19673 |
| PUT | 130 | 2026-06-18 | 17.15 | 18.5 | 17.8 | 110.8% | 155 | 15623 |
| CALL | 131 | 2026-06-18 | 0.02 | 0.07 | 0.03 | 78.6% | 343 | 474 |
| PUT | 131 | 2026-06-18 | 17.25 | 19.5 | 18.23 | 1.5% | 12 | 157 |
| CALL | 132 | 2026-06-18 | 0.02 | 0.07 | 0.02 | 81.5% | 204 | 603 |
| PUT | 132 | 2026-06-18 | 18.4 | 20.0 | - | 1.5% | - | 156 |
| CALL | 133 | 2026-06-18 | 0.01 | 0.04 | 0.02 | 79.5% | 371 | 325 |
| PUT | 133 | 2026-06-18 | 19.6 | 21.3 | 20.15 | 82.5% | 1 | 126 |
| CALL | 134 | 2026-06-18 | 0.01 | 0.07 | 0.04 | 85.4% | 69 | 1324 |
| PUT | 134 | 2026-06-18 | 20.3 | 22.5 | 21.08 | 1.5% | 3 | 251 |
| CALL | 135 | 2026-06-18 | 0.01 | 0.04 | 0.02 | 85.4% | 186 | 15634 |
| PUT | 135 | 2026-06-18 | 21.8 | 23.25 | 22.38 | 102.9% | 155 | 13794 |
| CALL | 136 | 2026-06-18 | 0.02 | 0.03 | 0.05 | 88.3% | 21 | 1044 |
| PUT | 136 | 2026-06-18 | 22.75 | 24.55 | 23.72 | 121.5% | 6 | 129 |
| CALL | 137 | 2026-06-18 | 0.01 | 0.06 | 0.03 | 91.2% | 57 | 996 |
| PUT | 137 | 2026-06-18 | 23.3 | 25.0 | 23.85 | 1.5% | 1 | 10 |
| CALL | 138 | 2026-06-18 | 0.01 | 0.23 | 0.01 | 114.7% | 503 | 356 |
| PUT | 138 | 2026-06-18 | 23.8 | 26.0 | - | 1.5% | - | 2 |
| CALL | 139 | 2026-06-18 | - | 0.01 | 0.01 | 85.4% | 340 | 845 |
| PUT | 139 | 2026-06-18 | 25.0 | 27.1 | 26.2 | 1.5% | 1 | 12 |
| CALL | 140 | 2026-06-18 | - | 0.01 | 0.01 | 88.3% | 90 | 32503 |
| PUT | 140 | 2026-06-18 | 27.0 | 28.5 | 27.0 | 145.9% | 18774 | 6913 |
| CALL | 141 | 2026-06-18 | - | 0.07 | 0.04 | 91.2% | 11 | 512 |
| PUT | 141 | 2026-06-18 | 27.1 | 29.4 | 27.9 | 1.5% | 1 | - |
| CALL | 142 | 2026-06-18 | - | 0.02 | 0.02 | 93.2% | 238 | 306 |
| PUT | 142 | 2026-06-18 | 28.8 | 30.0 | 28.8 | 1.5% | 3 | - |
| CALL | 143 | 2026-06-18 | - | 0.09 | 0.07 | 96.1% | 2 | 511 |
| PUT | 143 | 2026-06-18 | 29.1 | 31.0 | - | 1.5% | - | 1 |
| CALL | 144 | 2026-06-18 | - | 0.06 | 0.06 | 98.1% | 2 | 215 |
| PUT | 144 | 2026-06-18 | 30.15 | 32.35 | 30.78 | 1.5% | 1 | - |
| CALL | 145 | 2026-06-18 | - | 0.0 |
…(truncated)…
MCP tool: price_option_path
{"option_path": [16.09965290159478, 19.67398682711356, 26.624557319732943, 34.67234501790105, 43.82483967213882, 58.41869862484549, 74.80619160936467, 97.5890854116943, 121.51052700789032, 150.74813114331593], "volatility_used": 0.45223955114092573, "symbol": "BABA"}
MCP tool: get_option_chain
| Type | Strike | Expiration | Bid | Ask | Last | IV | Vol | OI |
|---|---|---|---|---|---|---|---|---|
| CALL | 30 | 2026-06-18 | 81.95 | 83.2 | 82.2 | 522.5% | - | 1 |
| PUT | 30 | 2026-06-18 | - | 0.01 | - | 488.3% | - | 1 |
| CALL | 35 | 2026-06-18 | 76.95 | 79.1 | 80.7 | 694.2% | - | - |
| PUT | 35 | 2026-06-18 | - | 0.25 | - | 432.7% | - | 2 |
| CALL | 40 | 2026-06-18 | 71.4 | 74.4 | - | 585.9% | - | - |
| PUT | 40 | 2026-06-18 | - | 1.95 | - | 384.9% | - | 3 |
| CALL | 45 | 2026-06-18 | 66.95 | 69.15 | - | 558.5% | - | - |
| PUT | 45 | 2026-06-18 | - | 1.82 | - | 342.9% | - | 2 |
| CALL | 50 | 2026-06-18 | 61.85 | 64.35 | 65.7 | 508.8% | - | - |
| PUT | 50 | 2026-06-18 | - | 0.02 | - | 305.9% | - | 46 |
| CALL | 55 | 2026-06-18 | 56.5 | 59.4 | 60.7 | 428.8% | - | - |
| PUT | 55 | 2026-06-18 | - | 0.03 | - | 271.7% | - | 10 |
| CALL | 60 | 2026-06-18 | 51.5 | 53.75 | 55.69 | 285.4% | - | - |
| PUT | 60 | 2026-06-18 | - | 0.05 | - | 240.5% | - | 80 |
| CALL | 65 | 2026-06-18 | 46.55 | 48.8 | 50.7 | 274.7% | - | - |
| PUT | 65 | 2026-06-18 | - | 0.08 | - | 211.2% | - | 70 |
| CALL | 70 | 2026-06-18 | 41.5 | 43.8 | 45.7 | 232.7% | - | 2 |
| PUT | 70 | 2026-06-18 | - | 0.12 | - | 184.9% | - | 109 |
| CALL | 75 | 2026-06-18 | 36.45 | 38.8 | 36.24 | 189.8% | - | 2 |
| PUT | 75 | 2026-06-18 | - | 0.33 | 0.01 | 159.5% | 5 | 139 |
| CALL | 80 | 2026-06-18 | 31.55 | 34.35 | 36.35 | 224.9% | - | 1 |
| PUT | 80 | 2026-06-18 | - | 0.05 | - | 136.1% | - | 1114 |
| CALL | 85 | 2026-06-18 | 26.4 | 28.8 | 31.8 | 125.4% | - | - |
| PUT | 85 | 2026-06-18 | - | 0.1 | 0.01 | 113.7% | 2 | 5680 |
| CALL | 90 | 2026-06-18 | 22.1 | 23.7 | 22.44 | 153.7% | - | 23 |
| PUT | 90 | 2026-06-18 | - | 0.01 | 0.01 | 92.2% | 47 | 1742 |
| CALL | 95 | 2026-06-18 | 17.1 | 18.7 | 21.75 | 123.4% | - | 3 |
| PUT | 95 | 2026-06-18 | 0.01 | 0.05 | 0.03 | 82.5% | 648 | 3091 |
| CALL | 100 | 2026-06-18 | 12.3 | 12.9 | 12.45 | 57.1% | 3 | 143 |
| PUT | 100 | 2026-06-18 | 0.03 | 0.1 | 0.05 | 67.8% | 174 | 7819 |
| CALL | 101 | 2026-06-18 | 11.1 | 12.1 | - | 52.2% | - | - |
| PUT | 101 | 2026-06-18 | - | 0.11 | 0.04 | 48.3% | 523 | 2 |
| CALL | 102 | 2026-06-18 | 10.15 | 11.9 | - | 88.3% | - | - |
| PUT | 102 | 2026-06-18 | - | 0.1 | 0.08 | 44.4% | 48 | 42 |
| CALL | 103 | 2026-06-18 | 9.2 | 10.55 | - | 73.7% | - | - |
| PUT | 103 | 2026-06-18 | 0.01 | 0.16 | 0.09 | 56.1% | 36 | 284 |
| CALL | 104 | 2026-06-18 | 8.05 | 9.55 | 9.36 | 62.0% | 3 | 1 |
| PUT | 104 | 2026-06-18 | 0.09 | 0.16 | 0.12 | 54.2% | 55 | 136 |
| CALL | 105 | 2026-06-18 | 6.85 | 8.25 | 7.73 | 1.5% | 5 | 161 |
| PUT | 105 | 2026-06-18 | 0.15 | 0.17 | 0.17 | 52.2% | 1439 | 2079 |
| CALL | 106 | 2026-06-18 | 6.3 | 7.35 | 6.83 | 51.2% | 5 | 7 |
| PUT | 106 | 2026-06-18 | 0.19 | 0.25 | 0.25 | 50.3% | 253 | 198 |
| CALL | 107 | 2026-06-18 | 5.55 | 6.5 | 5.6 | 55.1% | 71 | 8 |
| PUT | 107 | 2026-06-18 | 0.28 | 0.35 | 0.3 | 49.3% | 1249 | 284 |
| CALL | 108 | 2026-06-18 | 4.3 | 5.6 | 4.7 | 45.4% | 97 | 29 |
| PUT | 108 | 2026-06-18 | 0.37 | 0.49 | 0.47 | 47.3% | 339 | 1311 |
| CALL | 109 | 2026-06-18 | 4.0 | 4.35 | 3.9 | 46.4% | 30 | 14 |
| PUT | 109 | 2026-06-18 | 0.56 | 0.65 | 0.65 | 46.4% | 3202 | 1015 |
| CALL | 110 | 2026-06-18 | 3.3 | 3.6 | 3.4 | 46.4% | 294 | 1598 |
| PUT | 110 | 2026-06-18 | 0.81 | 0.9 | 0.85 | 46.4% | 1030 | 6616 |
| CALL | 111 | 2026-06-18 | 2.6 | 2.9 | 2.6 | 45.4% | 359 | 1043 |
| PUT | 111 | 2026-06-18 | 1.11 | 1.32 | 1.29 | 47.3% | 513 | 868 |
| CALL | 112 | 2026-06-18 | 2.08 | 2.31 | 2.14 | 46.4% | 853 | 751 |
| PUT | 112 | 2026-06-18 | 1.51 | 1.69 | 1.63 | 46.4% | 235 | 482 |
| CALL | 113 | 2026-06-18 | 1.62 | 1.74 | 1.73 | 46.4% | 1374 | 5262 |
| PUT | 113 | 2026-06-18 | 2.0 | 2.31 | 2.23 | 47.3% | 355 | 189 |
| CALL | 114 | 2026-06-18 | 1.24 | 1.4 | 1.32 | 47.3% | 1675 | 711 |
| PUT | 114 | 2026-06-18 | 2.56 | 3.05 | 2.52 | 49.3% | 31 | 327 |
| CALL | 115 | 2026-06-18 | 1.0 | 1.06 | 0.98 | 49.3% | 8609 | 5448 |
| PUT | 115 | 2026-06-18 | 3.25 | 3.7 | 3.5 | 50.3% | 565 | 8310 |
| CALL | 116 | 2026-06-18 | 0.7 | 0.82 | 0.74 | 49.3% | 1820 | 711 |
| PUT | 116 | 2026-06-18 | 3.8 | 4.55 | 4.37 | 49.3% | 30 | 102 |
| CALL | 117 | 2026-06-18 | 0.51 | 0.62 | 0.56 | 49.3% | 887 | 1083 |
| PUT | 117 | 2026-06-18 | 4.8 | 5.5 | 4.9 | 55.1% | 4 | 175 |
| CALL | 118 | 2026-06-18 | 0.38 | 0.44 | 0.41 | 50.3% | 2208 | 949 |
| PUT | 118 | 2026-06-18 | 5.2 | 6.55 | 5.8 | 52.2% | 55 | 62 |
| CALL | 119 | 2026-06-18 | 0.29 | 0.34 | 0.29 | 52.2% | 740 | 1542 |
| PUT | 119 | 2026-06-18 | 5.7 | 7.55 | 6.25 | 46.4% | 1 | 27 |
| CALL | 120 | 2026-06-18 | 0.22 | 0.24 | 0.23 | 52.2% | 5149 | 9847 |
| PUT | 120 | 2026-06-18 | 7.45 | 7.9 | 7.8 | 54.2% | 596 | 15061 |
| CALL | 121 | 2026-06-18 | 0.14 | 0.19 | 0.17 | 53.2% | 557 | 1251 |
| PUT | 121 | 2026-06-18 | 8.4 | 9.6 | 8.32 | 74.7% | 1 | 547 |
| CALL | 122 | 2026-06-18 | 0.13 | 0.15 | 0.14 | 56.1% | 346 | 1018 |
| PUT | 122 | 2026-06-18 | 8.55 | 10.5 | 9.11 | 53.2% | 1 | 265 |
| CALL | 123 | 2026-06-18 | 0.09 | 0.12 | 0.11 | 56.1% | 539 | 4414 |
| PUT | 123 | 2026-06-18 | 10.05 | 11.55 | 10.55 | 76.6% | 16 | 3179 |
| CALL | 124 | 2026-06-18 | 0.07 | 0.11 | 0.08 | 59.0% | 1104 | 447 |
| PUT | 124 | 2026-06-18 | 11.0 | 12.4 | 11.22 | 75.6% | 3 | 549 |
| CALL | 125 | 2026-06-18 | - | 0.08 | 0.06 | 46.4% | 1797 | 6519 |
| PUT | 125 | 2026-06-18 | 12.3 | 12.8 | 12.7 | 67.8% | 232 | 13235 |
| CALL | 126 | 2026-06-18 | 0.04 | 0.07 | 0.06 | 62.9% | 55 | 391 |
| PUT | 126 | 2026-06-18 | 12.95 | 14.5 | 13.22 | 86.4% | 13 | 289 |
| CALL | 127 | 2026-06-18 | 0.03 | 0.08 | 0.05 | 65.9% | 33 | 1960 |
| PUT | 127 | 2026-06-18 | 14.1 | 15.0 | 13.91 | 76.6% | 10 | 204 |
| CALL | 128 | 2026-06-18 | 0.04 | 0.06 | 0.05 | 67.8% | 78 | 231 |
| PUT | 128 | 2026-06-18 | 14.85 | 16.55 | 15.75 | 93.2% | 48 | 455 |
| CALL | 129 | 2026-06-18 | - | 0.06 | 0.06 | 58.1% | 229 | 1681 |
| PUT | 129 | 2026-06-18 | 15.8 | 17.6 | 16.64 | 98.1% | 20 | 260 |
| CALL | 130 | 2026-06-18 | - | 0.04 | 0.04 | 61.0% | 655 | 19673 |
| PUT | 130 | 2026-06-18 | 17.15 | 18.5 | 17.8 | 110.8% | 155 | 15623 |
| CALL | 131 | 2026-06-18 | 0.02 | 0.07 | 0.03 | 78.6% | 343 | 474 |
| PUT | 131 | 2026-06-18 | 17.25 | 19.5 | 18.23 | 1.5% | 12 | 157 |
| CALL | 132 | 2026-06-18 | 0.02 | 0.07 | 0.02 | 81.5% | 204 | 603 |
| PUT | 132 | 2026-06-18 | 18.4 | 20.0 | - | 1.5% | - | 156 |
| CALL | 133 | 2026-06-18 | 0.01 | 0.04 | 0.02 | 79.5% | 371 | 325 |
| PUT | 133 | 2026-06-18 | 19.6 | 21.3 | 20.15 | 82.5% | 1 | 126 |
| CALL | 134 | 2026-06-18 | 0.01 | 0.07 | 0.04 | 85.4% | 69 | 1324 |
| PUT | 134 | 2026-06-18 | 20.3 | 22.5 | 21.08 | 1.5% | 3 | 251 |
| CALL | 135 | 2026-06-18 | 0.01 | 0.04 | 0.02 | 85.4% | 186 | 15634 |
| PUT | 135 | 2026-06-18 | 21.8 | 23.25 | 22.38 | 102.9% | 155 | 13794 |
| CALL | 136 | 2026-06-18 | 0.02 | 0.03 | 0.05 | 88.3% | 21 | 1044 |
| PUT | 136 | 2026-06-18 | 22.75 | 24.55 | 23.72 | 121.5% | 6 | 129 |
| CALL | 137 | 2026-06-18 | 0.01 | 0.06 | 0.03 | 91.2% | 57 | 996 |
| PUT | 137 | 2026-06-18 | 23.3 | 25.0 | 23.85 | 1.5% | 1 | 10 |
| CALL | 138 | 2026-06-18 | 0.01 | 0.23 | 0.01 | 114.7% | 503 | 356 |
| PUT | 138 | 2026-06-18 | 23.8 | 26.0 | - | 1.5% | - | 2 |
| CALL | 139 | 2026-06-18 | - | 0.01 | 0.01 | 85.4% | 340 | 845 |
| PUT | 139 | 2026-06-18 | 25.0 | 27.1 | 26.2 | 1.5% | 1 | 12 |
| CALL | 140 | 2026-06-18 | - | 0.01 | 0.01 | 88.3% | 90 | 32503 |
| PUT | 140 | 2026-06-18 | 27.0 | 28.5 | 27.0 | 145.9% | 18774 | 6913 |
| CALL | 141 | 2026-06-18 | - | 0.07 | 0.04 | 91.2% | 11 | 512 |
| PUT | 141 | 2026-06-18 | 27.1 | 29.4 | 27.9 | 1.5% | 1 | - |
| CALL | 142 | 2026-06-18 | - | 0.02 | 0.02 | 93.2% | 238 | 306 |
| PUT | 142 | 2026-06-18 | 28.8 | 30.0 | 28.8 | 1.5% | 3 | - |
| CALL | 143 | 2026-06-18 | - | 0.09 | 0.07 | 96.1% | 2 | 511 |
| PUT | 143 | 2026-06-18 | 29.1 | 31.0 | - | 1.5% | - | 1 |
| CALL | 144 | 2026-06-18 | - | 0.06 | 0.06 | 98.1% | 2 | 215 |
| PUT | 144 | 2026-06-18 | 30.15 | 32.35 | 30.78 | 1.5% | 1 | - |
| CALL | 145 | 2026-06-18 | - | 0.0 |
…(truncated)…
MCP tool: price_option_path
{"option_path": [23.964662916957764, 29.79329633566107, 36.24548615198839, 43.575209428115656, 52.57735437006821], "volatility_used": 0.45223955114092573, "symbol": "BABA"}
MCP tool: price_option_path
{"option_path": [18.554140392855395, 19.929508133024996, 22.448132196241907, 25.72319706610412, 29.238640406522848, 32.308432690390234, 35.576294323992755, 39.881186581919664, 46.31941637372182, 53.52666887183773, 61.635759327811314, 75.62926537285821], "volatility_used": 0.45223955114092573, "symbol": "BABA"}
MCP tool: price_option_path
{"option_path": [11.060795820064854, 11.517907585335294, 12.65568153876503, 14.18261522125271, 15.71992032335178, 16.754838471222705, 19.272550773916763, 21.955840391200496, 24.88538136211821, 32.74991727468043], "volatility_used": 0.45223955114092573, "symbol": "BABA"}
MCP tool: price_option_path
{"option_path": [19.7486273358926, 23.75123180278836, 30.275121255597185, 42.82133509747018], "volatility_used": 0.45223955114092573, "symbol": "BABA"}
MCP tool: price_option_path
{"option_path": [27.994679882797485, 19.532620219883697, 11.980560979958177, 5.789537489645237, 1.6236849203190182, 0.15459002338005767], "volatility_used": 0.45223955114092573, "symbol": "BABA"}
MCP tool: price_option_path
{"option_path": [24.80965795585724, 26.54826049670332, 30.858627652342108, 38.44995680471928, 46.87255827839539], "volatility_used": 0.45223955114092573, "symbol": "BABA"}
MCP tool: price_option_path
{"option_path": [7.074958971410496, 7.146479431471171, 7.929124136978459, 9.625436902865587, 15.14930445708746], "volatility_used": 0.45223955114092573, "symbol": "BABA"}
MCP tool: price_option_path
{"option_path": [44.95800855880408, 47.17030255923409, 50.122860251416576, 54.89842708233901, 57.2666832289859], "volatility_used": 0.45223955114092573, "symbol": "BABA"}
Debate Transcripts
- ■
Ownership & Trade Secrets. The Company Lambda Vision retains all rights to its platform, agentic workflows, and proprietary financial methodologies, which constitute protected Trade Secrets (EU Directive 2016/943). Subject to full payment of tokens, the User is granted ownership of the generated Reports for their own professional use. Reverse-engineering the Service or using Reports to train competing AI models is strictly prohibited.
- ■
No Financial Advice. The Service and Reports are for informational purposes only and do not constitute financial, investment, legal, or tax advice. The Company is not a regulated financial advisor. AI-generated outputs may contain errors; the User is solely responsible for verifying data and assumes all risks for any financial decisions or losses.
- ■
Liability & Governing Law. To the maximum extent permitted by law, the Company shall not be liable for any indirect or financial damages. These Terms are governed by French law. Any disputes shall be subject to the exclusive jurisdiction of the Courts of Paris, France.