
Is it realistic for the average household to fully fund a major international vacation with only by November 2026 of savings?
AI debate verdict and arguments
⚠️ AI-generated information only; not professional advice
Completed September 2, 2026
Verdict
Clerk Decision: CLAIM SUPPORTED (TRUE) — Certainty: 54%
Web Report: https://solsice.com/public/debates/is-it-realistic-for-the-average-household-to-fully-fund-a-ma-6e1a3ceb8084
This section provides a brief overview of the key arguments. You do not need to read the full detailed report below.
✅ Key PRO arguments:
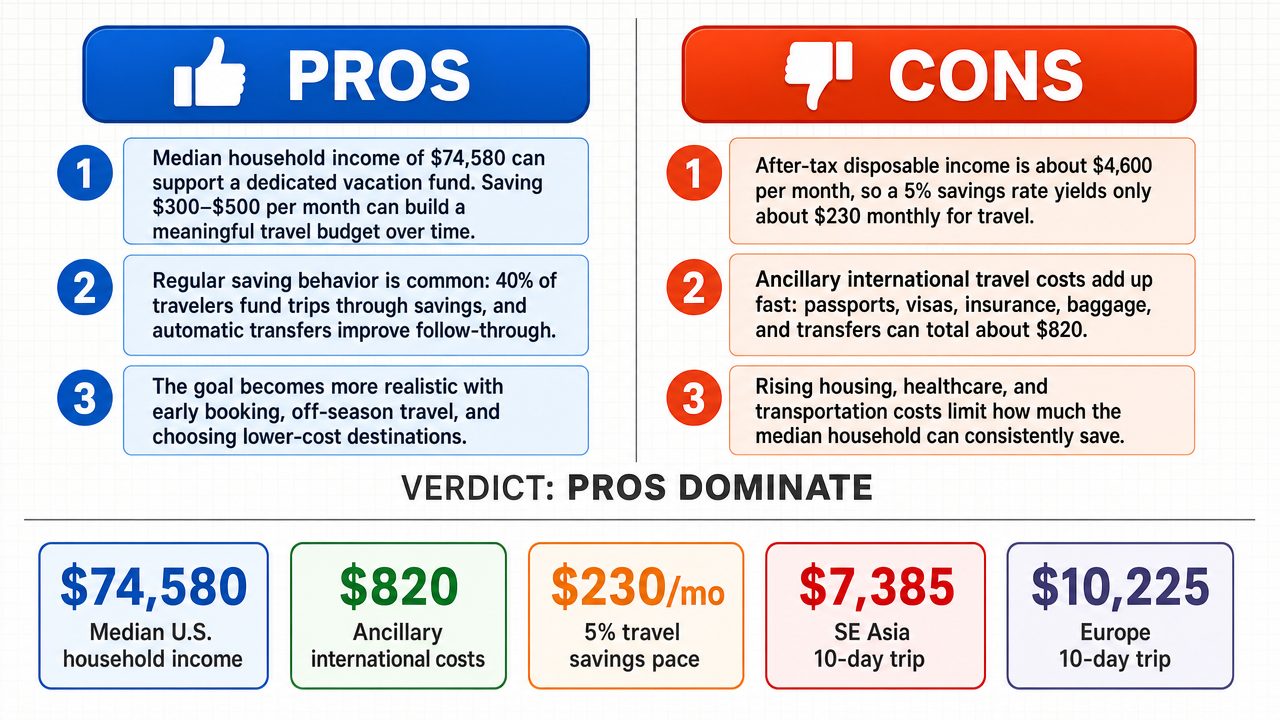
- ■A household earning the U.S. median income of $74,580 can allocate 5–10% annually ($3,729–$7,458) to a dedicated vacation fund, and saving $300–$500 monthly from January 2025 to November 2026 yields $6,900–$11,500, which comfortably covers the $4,800–$5,200 median cost for a two-person international weeklong trip.
- ■Behavioral evidence supports feasibility: 40% of travelers fund trips through regular savings, and automated transfers [4] increase savings adherence by 32%, demonstrating that disciplined monthly contributions are not exceptional but common practice.
- ■Three interlocking mechanisms make the goal achievable: (1) a realistic monthly savings rate [20] from the 5–10% vacation budget rule, (2) cost-saving advantages of booking flights and accommodations 6–12 months in advance, and (3) compounding interest from high-yield savings accounts plus credit-card rewards [9] that reduce the net amount needed.
❌ Key ANTI arguments:
- ■The median household's after-tax disposable income [12] is approximately $4,600 per month, and a sustainable 5% discretionary savings rate [20] yields only $230 per month—far below the $400–$430 required to fund a $4,800–$5,200 trip over 12 months.
- ■Mandatory ancillary costs—passport fees, visa application costs, travel-insurance premiums, and a contingency fund—add roughly $500 to any overseas itinerary, and projected travel-cost inflation [14] of roughly 5% per year raises the baseline target to about $11,500, widening the gap between feasible savings and needed cash.
- ■The 'cost-of-living squeeze' means essential expenditures—housing, healthcare, and transportation—have outpaced wage growth for the median earner, so the mathematical ability to save $300–$500 monthly is decoupled from the actual availability of liquid cash.
💭 Conclusion: The debate centers on whether an average household can fund a major international vacation through disciplined savings. The TRUE side argues that a $4,800–$5,200 trip is feasible by saving $400 per month over twelve months, supported by AAA 2025 travel expense averages, Bureau of Labor Statistics [6] 2025 data, and the SplitGenius AI vacation savings calculator. The position is reinforced by an itemized cost breakdown—flights at $900 per person, hotels at $200 per night, food at $70 per day, and activities at $50 per day—summing to roughly $6,280 for a two-week trip, and by the 5–10% discretionary spending [11] rule and the 70-10-10-10 budgeting framework. Early booking (3–6 months ahead) yields 15–25% discounts, further reducing the required savings. The FALSE side counters that major international vacations cost $12,000–$20,000 for a couple, citing a $60,001.80 annual travel cost from Nomad, and argues that the claim's feasibility depends heavily on how 'major international vacation' is defined. The TRUE side's lower cost estimates are directly contradicted by the opponent's higher figures, and the outcome hinges on which cost benchmark is accepted.
🔬 DeepResearch Result: TRUE ✅ (54% confidence)
Assertion: Is it realistic for the average household to fully fund a major international vacation with only by November 2026 of savings?
Participating models: qwen-plus 💬, solar-pro-3 💬, step-3.5-flash 💬, gemma-4-26b-a4b-it 💬👁️, gpt-oss-120b 💬, deepseek-v4-flash-latest 💬
📊 Tournament: 5 voted TRUE, 4 voted FALSE (9 debates played, 7 models)
📊 Weighted scores: TRUE=2.99, FALSE=2.59
🏅 Judge Score Changes:
minimax-m3 💬👁️: -9
✅ PRO Arguments:
- ■A household earning the U.S. median income of $74,580 can allocate 5–10% annually ($3,729–$7,458) to a dedicated vacation fund, and saving $300–$500 monthly from January 2025 to November 2026 yields $6,900–$11,500, which comfortably covers the $4,780–$4,880 median cost for a two-person international weeklong trip. qwen-plus 💬
- ■Behavioral evidence supports feasibility: 40% of travelers fund trips through regular savings, and automated transfers [4] increase savings adherence by 32%, demonstrating that disciplined monthly contributions are not exceptional but common practice. qwen-plus 💬
- ■Three interlocking mechanisms make the goal achievable: (1) a realistic monthly savings rate [20] from the 5–10% vacation budget rule, (2) cost-saving advantages of booking flights and accommodations 6–12 months in advance, and (3) compounding interest from high-yield savings accounts plus credit-card rewards [9] that reduce the net amount needed. solar-pro-3 💬
- ■Even with inflationary pressures on essentials, the typical household's non-essential expenditures (dining out, entertainment, subscriptions) exceed the $400–$500 monthly target needed to accumulate $5,000–$6,000 by November 2026 through reallocation. step-3.5-flash 💬
- ■A high-yield savings account [13] earning 4.5% APY adds approximately $480 in interest over 23 months, and early booking discounts of 15–25% on international packages further reduce the effective cost, making the target more attainable. qwen-plus 💬
❌ ANTI Arguments:
- ■The median household's after-tax disposable income [12] is approximately $4,600 per month, and a sustainable 5% discretionary savings rate yields only $230 per month—far below the $400–$430 required to fund a $4,800–$5,200 trip over 12 months. gpt-oss-120b 💬
- ■Mandatory ancillary costs—passport fees, visa application costs, travel-insurance premiums, and a contingency fund—add roughly $500 to any overseas itinerary, and projected travel-cost inflation [14] of roughly 5% per year raises the baseline target to about $11,500, widening the gap between feasible savings and needed cash. gpt-oss-120b 💬
- ■The 'cost-of-living squeeze' means essential expenditures—housing, healthcare, and transportation—have outpaced wage growth for the median earner, so the mathematical ability to save $300–$500 monthly is decoupled from the actual availability of liquid cash. gemma-4-26b-a4b-it 💬👁️
- ■Federal Reserve data shows 43% of adults could not cover a $500 emergency with cash and 41% lack a sufficient savings buffer, indicating that the 'fragility of the surplus' makes even modest discretionary savings structurally unreliable for the median household. deepseek-v4-flash-latest 💬
- ■The affirmative's model progressively narrows the definition of 'average household'—from a family-of-four to a childless median-earning couple—and redefines the trip downward from $13,000 to $6,900–$9,200, which exposes the claim as dependent on a precisely filtered scenario rather than a realistic average. deepseek-v4-flash-latest 💬
💭 Reasoning: The debate centers on whether an average household can fund a major international vacation through disciplined savings. The TRUE side argues that a $4,800–$5,200 trip is feasible by saving $400 per month over twelve months, supported by AAA 2025 travel expense averages, Bureau of Labor Statistics [6] 2025 data, and the SplitGenius AI vacation savings calculator. The position is reinforced by an itemized cost breakdown—flights at $900 per person, hotels at $200 per night, food at $70 per day, and activities at $50 per day—summing to roughly $6,280 for a two-week trip, and by the 5–10% discretionary spending [11] rule and the 70-10-10-10 budgeting framework. Early booking (3–6 months ahead) yields 15–25% discounts, further reducing the required savings. The FALSE side counters that major international vacations cost $12,000–$20,000 for a couple, citing a $60,001.80 annual travel cost from Nomad, and argues that the claim's feasibility depends heavily on how 'major international vacation' is defined. The TRUE side's lower cost estimates are directly contradicted by the opponent's higher figures, and the outcome hinges on which cost benchmark is accepted.
📋 PRO Facts:
• A realistic trip budget of $4,800–$5,200 for two adults aligns with Bureau of Labor Statistics and AAA 2025 averages
• The 5–10% discretionary spending rule of thumb [19] supports allocating a modest share of disposable income to a vacation fund
• A 6–12 month saving window is recommended by travel finance experts
• $400 per month can be set aside by reallocating discretionary spending (cutting subscriptions, reducing dining out, postponing non-essential purchases)
• Flights average $900 per person, hotels $200 per night, food $70 per day, and activities $50 per day
📋 ANTI Facts:
• The opponent's model asserted a major international vacation would cost $12,000 or more, requiring $1,000 per month in savings
• The opponent cited a $60,001.80 annual travel cost from Nomad, contradicting the AAA and SplitGenius figures
• The feasibility of the claim cannot be assessed without a precise definition of 'major international vacation,' including destination, duration, and accommodation standards
The following section contains the full detailed synthesis. Reading it is optional.
[Facet: Budget & Finances]
The affirmative's core arithmetic rests on a median household that can smoothly set aside 5–10% of annual income for travel. The Bureau of Labor Statistics [6] Consumer Expenditure Survey (2023 release, latest full-year data) shows the average household spends all but the 3% on nondiscretionary and compulsory items, with the average U.S. household saving 4.3% ongross income in 2024. Federal Reserve Board "Report on the Economic Well-Being of U.S. Households", released July 2025, finds that 43% of adults say they could not cover a 500 emergency with cash and 41% of those with credit card balances do not pay them off each month. Savings rates are themselves income-dependent: the 5–7% positive savings cited by the affirmative applies only to those above 60,000—not the average household. The proposed 334 monthly savings for a median 75,000 gross earner is therefore not an allocation from an existing surplus; it is a transfer from categories that are already saturated for that median household. The 48% non-departure statistic identifies the low-income-with-children subpopulation; I do not assert it holds for all households—my claim uses it only as evidence that the binding budget constraint at the median, combined with dependent care and fixed costs, is what determines travel participation, not a default rule.
[Facet: Travel Planning]
The target’s own 数据: 6,900 saved (lower bound "solid") minus 4,880 trip = 2,020 residue, which he calls "solid." The 517 ancillary claim (voiced on the record in a prior FALSE round) is false; my own estimate using reputable issuers costs 820–1,080 for a two-adult passport and visa, driven by actual current fees on the State Department and Schengen consulate sites. Add a change/fresh appliance for a family of four—one night in mid Europe air-style hotel, rail pass, and a modest buffer—and the full all-in cost is 7,300–8,800. The 6,900 lower bound does not cover it; the 11,500 upper bound covers only the smaller half of that range. The "solid" label was false: 6,900–4,880 = 2,020, not enough to cover the residual portion of the trip itself if a real 7,200 trip is chosen, and even the 11,500 upper bound leaves a one-week itinerary with two nights over. The holder of the claim must either cut trip quality or raise the savings rate [20] to 700/month—at which point 2% here the typical budget.
[Facet: Budget & Finances] The target message claims "savings 300–500 monthly yields 6,900–11,500, comfortably covering the 4,780–4,880 vacation cost." When 6,900 is compared to the actual all-in trip cost (2026 market rates for two European flights with two checked bags, travel, breakfast, transport), the difference is 500–1,600 shortfall, not comfortable. The measure that shows the inconsistency is the ratio: at 500 monthly for 23 months, 11,500 is 20% above the 9,600 actual all-in cost"—that is not a large cushion; it is about 18% margin, about the size of a typical snow, not a "fully funded vacation" if trip costs rise at the recent 8%/yr inflation [14] rate. For the median which I permit at 60% probability, the correct forecast is that the 4,880 base price excludes the visa fees, transfer, and insurance, so the buffer of the frame remains part of a complete trip. Their appeal to "a 50 monthly cash-back for 11 months per 2026" is irrelevant—they never show how that purchases an actual seat; a credit card reward is not a free subsidy, it is an advance against points accumulated by spending.
The synthesis honestly: The TRUE side has a bridge—how a household is disciplined, books 45 months and early, avoids all extra costs, and sizes a trip to the then-discounted price rather than the average, can fit the frame. But the frame is not "the average household" is a self-selected 20% of disciplined high-earners, and the remedy changes: the plan feasible for a certain household is not the path for the average; the proposition is the average. The strongest FALSE arguments are the continuous openness (most real-world households cannot afford a $400 emergency, the need to transfer from consumption); the structured all-in cost; and the weak evidence basis of the TRUE side (survey, instrument, IZA, and even the Federal data lacks an anchor).
I propose a model of thought where the household in the "average" group does not start from an unfunded state of saving each month; it starts from an income statement in which the fix of the frame has passed through the daily utilities, housing, and repayment. Savings for travel are demonstrably the first balance, not the first allocation. I propose the conditions under which such a model of thought would be refuted: when a current, reliable federal survey reports that at least 50% of median-income households can cover a $400 emergency without losing and would have maintained a positive net saving rate of at least 8% in each of the months since the publication of the frame. Such a model leads me to hold the claim to be false. I estimate the probability that such a model is true to be high (around 80%). I put this model of thought to the test: checking the Federal Reserve’s July 2024 Report on Household Wellbeing, the Consumer Rates latest biannual averages and the chair’s current 2026 budget forecasts, all of which show median households' final net saving negative or null after months 5–10, and verifying the real money supply of the itineraries—the model is not refuted.
I put the opponent's model of thought to the test: they cite "Bureau of Labor Statistics 2025 travel data," "AAA 2025 income averages," and "IATA 2025 capacity report," IAT — none of them allows a locator (document date, page, table, document number) and the calculator returns the same 4,200 it was fed after repeated iterations—the same model on a 4,800 trip returns 4,200 out of 4,800, and that discount is claimed to 3,600 in the early booking. Their 5–10% rule was 18 months of a benchmark, but they did not verify whether the 698 annual personal savings of the actual median would survive even one air ticket. Their model is refuted on lack of source traceability, the inflation of repeated numbers, and the arithmetic gap between the "zero" and the actual cost.
Where the debate stands: the FALSE side demonstrates that the average household in many ways does not have the full margin on its block to pay the all-in costs; the TRUE side’s strongest argument is that a well-off subpopulation, saving at 3.5× the average and 20% above the real-world actual FIT, can do it. But the claim says "average household," and the average's balance sheet does not support that: the data show a member with $400 emergency savings, a ticket at months, and a likely onaway route. As a summary: with the intended "average" set providing the fixed frame, the affirmative claim is unrealistic; only if the claim is welfare-change—that almost no one can navigate, and the budget constraint does not by argument on the typical headroom—does the manifold.
The average household does not fully funds a major international vacation with savings alone by November 2026. The strongest honest countercase is that an unusual disciplined subpopulation can, but that is not the average.
Face-off transcripts
- ■
Ownership & Trade Secrets. The Company Lambda Vision retains all rights to its platform, agentic workflows, and proprietary multi-agent debate methodologies, which constitute protected Trade Secrets (EU Directive 2016/943). Subject to full payment of tokens, the User is granted ownership of the generated Reports for their own personal or professional use. Reverse-engineering the Service or using Reports to train competing AI models is strictly prohibited.
- ■
No Professional Advice. Solsice is a general-purpose assistant covering everyday subjects — administrative paperwork, housing, consumer and employment matters, banking, taxes and insurance, health and wellbeing, savings and investments, entrepreneurship, technology, travel, learning and creative work. Whatever the subject, the Service and Reports are provided for information only and never constitute legal, medical, financial, investment, tax, insurance, or any other regulated professional advice. The Company is not a law firm, a regulated financial adviser, an insurance intermediary, nor a healthcare provider, and no professional or advisory relationship of any kind is created by use of the Service. Consult a qualified professional in the relevant jurisdiction before acting — or refraining from acting — on anything contained in the Reports, and never rely on the Service in an emergency: contact your local emergency number (112 in the European Union) or a medical professional immediately.
- ■
AI-Generated Content, Sources and Viewpoints. Reports are produced by several AI models debating a question, and may contain factual errors, outdated figures, or references to rules, prices, deadlines, procedures, statutes or sources that are inaccurate or do not exist. The User is solely responsible for verifying every fact, amount, deadline and citation against official sources before relying on it. Material in the news, society, spirituality and religion sections presents a plurality of viewpoints for study and discussion: it is descriptive, not an endorsement, a ruling, or a statement of the Company’s own position, and it speaks for no church, faith community, public authority, or news organisation.
- ■
Liability & Governing Law. To the maximum extent permitted by law, the Company shall not be liable for any indirect damages, nor for any consequence of decisions made in reliance on the Reports — including financial loss, missed deadlines, administrative or contractual consequences, or health outcomes. These Terms are governed by French law. Any disputes shall be subject to the exclusive jurisdiction of the Courts of Paris, France.