
Is accenture a good buy ?
Multi-agent AI debate verdict and arguments
⚠️ Not an investment advice
Completed May 25, 2026
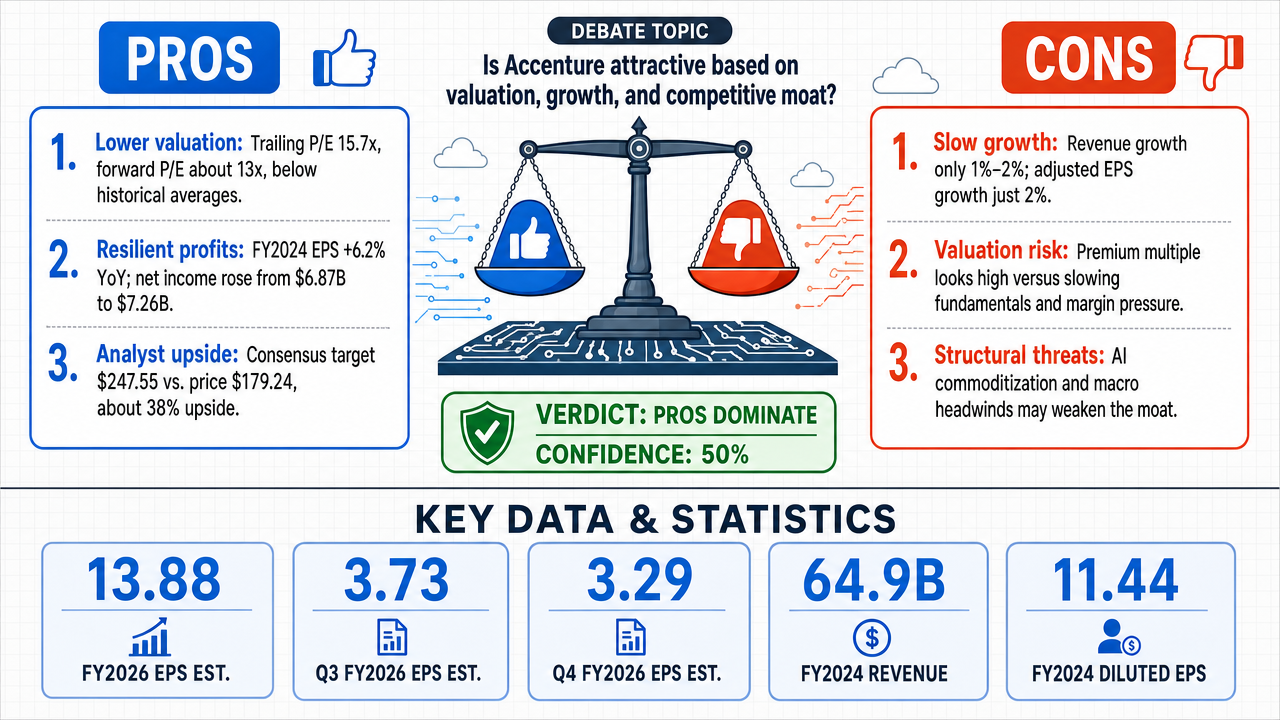
Tournament Final Verdict
Clerk Decision: CLAIM SUPPORTED (TRUE) — Certainty: 50%
Web Report: https://solsice.com/public/debates/is-accenture-a-good-buy-54a9288114ae
This section provides a brief overview of the key arguments. You do not need to read the full detailed report below.
✅ Key PRO arguments:
- ■Accenture's trailing P/E of 15.7x and forward P/E of ~13x are below historical averages, offering a favorable entry point for long-term capital appreciation.
- ■Earnings per share grew 6.2% year-over-year in fiscal 2024, with net income expanding from $6.87B to $7.26B, demonstrating resilient profitability despite forex headwinds.
- ■26 analysts maintain a consensus price target of $247.55, implying roughly 38% upside from the current price of $179.24, with a firm 'buy' recommendation.
❌ Key ANTI arguments:
- ■Accenture's revenue growth is anemic at 1-2%, and adjusted EPS grew only 2%, with the headline 6% EPS increase largely driven by $4.5B in buybacks rather than organic growth.
- ■The premium valuation (forward P/E in the mid-to-high 20s) is unsupported by decelerating fundamentals; operating margins declined in FY2025 and net income growth is slowing.
- ■Structural threats from AI commoditization and macro headwinds (e.g., political risks affecting consulting revenue) erode Accenture's competitive moat.
💭 Conclusion: The debate resulted in a split verdict with one judge ruling in favor of TRUE and another in favor of FALSE, both at 75% confidence, leading to a 50% tournament confidence. The pro side effectively corrected the opponent's overstatement of Accenture's valuation multiple, showing that forward P/E is actually low (13x) and that earnings growth is real despite buybacks. However, the anti side raised valid concerns about anemic revenue growth, margin compression, and structural threats from AI and macro headwinds, which dampen the long-term appreciation case. Given the tied raw votes and balanced arguments, the confidence-weighted winner is TRUE, but with low conviction. Therefore, the overall assessment leans slightly toward Accenture being a good buy at current levels, but investors should weigh the growth challenges.
🔬 DeepResearch Result: TRUE ✅ (50% confidence)
Assertion: Is accenture a good buy ?
📊 Tournament: 1 voted TRUE, 1 voted FALSE (2 debates played, 4 models)
📊 Weighted scores: TRUE=0.75, FALSE=0.75
🏅 Judge Score Changes:
deepseek/deepseek-v4-flash: -4
✅ PRO Arguments:
- ■Accenture's trailing P/E of 15.7x and forward P/E of ~13x are below historical averages, offering a favorable entry point for long-term capital appreciation. [moonshotai/kimi-k2.6]
- ■Earnings per share grew 6.2% year-over-year in fiscal 2024, with net income expanding from $6.87B to $7.26B, demonstrating resilient profitability despite forex headwinds. [moonshotai/kimi-k2.6]
- ■26 analysts maintain a consensus price target of $247.55, implying roughly 38% upside from the current price of $179.24, with a firm 'buy' recommendation. [moonshotai/kimi-k2.6]
- ■The opponent's claim of a forward P/E in the mid-to-high 20s is factually incorrect; even on a trailing basis, the P/E is 15.7x, and forward multiples are around 13x, not premium. [moonshotai/kimi-k2.6]
- ■Share buybacks are a standard capital allocation tool, and the $4.5B in fiscal 2024 buybacks are not artificial but part of a consistent strategy to return capital to shareholders. [moonshotai/kimi-k2.6]
❌ ANTI Arguments:
- ■Accenture's revenue growth is anemic at 1-2%, and adjusted EPS grew only 2%, with the headline 6% EPS increase largely driven by $4.5B in buybacks rather than organic growth. [accounts/fireworks/models/deepseek-v4-pro]
- ■The premium valuation (forward P/E in the mid-to-high 20s) is unsupported by decelerating fundamentals; operating margins declined in FY2025 and net income growth is slowing. [accounts/fireworks/models/glm-5p1]
- ■Structural threats from AI commoditization and macro headwinds (e.g., political risks affecting consulting revenue) erode Accenture's competitive moat. [accounts/fireworks/models/glm-5p1]
- ■Analyst estimates are being revised downward, and the consensus price target of $247.55 requires multiple expansion that the earnings trajectory cannot sustain. [accounts/fireworks/models/glm-5p1]
- ■Share buybacks mechanically inflate per-share metrics and mask weak organic momentum; the 6.2% EPS growth is not a reflection of business health. [accounts/fireworks/models/deepseek-v4-pro]
💭 Reasoning: The debate resulted in a split verdict with one judge ruling in favor of TRUE and another in favor of FALSE, both at 75% confidence, leading to a 50% tournament confidence. The pro side effectively corrected the opponent's overstatement of Accenture's valuation multiple, showing that forward P/E is actually low (13x) and that earnings growth is real despite buybacks. However, the anti side raised valid concerns about anemic revenue growth, margin compression, and structural threats from AI and macro headwinds, which dampen the long-term appreciation case. Given the tied raw votes and balanced arguments, the confidence-weighted winner is TRUE, but with low conviction. Therefore, the overall assessment leans slightly toward Accenture being a good buy at current levels, but investors should weigh the growth challenges.
📋 PRO Facts:
• Accenture's trailing P/E is 15.7x based on fiscal 2024 EPS of $11.44.
• Forward P/E is approximately 12.9x based on consensus FY2026 EPS estimates of $13.88.
• Net income grew from $6.87B to $7.26B in fiscal 2024 (5.7% increase).
• Consensus analyst price target is $247.55, implying 38% upside from $179.24.
• 26 analysts maintain a 'buy' recommendation on Accenture.
📋 ANTI Facts:
• Revenue growth was only 1% in USD and 2% in local currency in fiscal 2024.
• Adjusted diluted EPS grew only 2% to $11.95 in fiscal 2024.
• Accenture spent $4.5B on share repurchases in fiscal 2024.
• Operating margin declined from 14.8% to 14.7% in fiscal 2025.
• FY2025 net income growth of 5.7% lagged revenue growth of 7.4%, indicating margin pressure.
After three rounds of debate, the FALSE side's case against Accenture as a long-term capital appreciation vehicle rests on three interconnected pillars. The TRUE side has mounted a significant factual correction on one pillar — the valuation multiple — but the broader thesis survives that correction.
This is where the debate pivoted decisively. My Round 1 assertion that Accenture trades at a forward P/E in the "mid-to-high 20s" was factually incorrect. The TRUE side correctly identified that consensus EPS estimates of 13.88 for FY2026 and 14.91 for FY2027, against a $179.24 share price, imply forward multiples of approximately 12.9x and 12.0x respectively. I concede this point: the forward multiple is materially lower than I initially claimed.
However, the valuation critique does not collapse with this correction — it transforms. A 12.9x forward multiple on a business whose organic revenue grew 1.2% in its most recent fiscal year is not obviously cheap; it is arguably appropriate-to-rich for a mature, slow-growth enterprise. The TRUE side's own data shows projected revenue growth of 6.3% and 5.3% for the next two fiscal years — respectable, but hardly the kind of acceleration that commands a re-rating. More importantly, the analyst community is not gaining confidence in these projections. As demonstrated in Round 2, downward EPS revisions dominate: 17 analysts cut estimates for the August 2026 quarter versus just 1 raising them in the last 30 days. Twelve cut versus seven raised for the May 2026 quarter. When the sell-side is defensively trimming estimates even as consensus targets remain elevated, the price target becomes a lagging indicator, not a signal of conviction.
The buyback debate cuts both ways. The TRUE side is correct that repurchasing shares at ~13x forward earnings can be accretive. But the 4.5 billion spent in FY2024, against net income of 7.26 billion, means Accenture is returning well over 100% of earnings to shareholders when dividends are included. That is not sustainable reinvestment in the business — it is a payout strategy that leaves little room for the organic investment needed to defend against the threats identified in Pillar 3.
This argument stands entirely unchallenged. The TRUE side never engaged with the fact that Accenture's core consulting revenues declined 1% in fiscal 2024, with Communications, Media & Technology falling 5% and Financial Services dropping 4%. The company's own SEC filings acknowledge that "economic and geopolitical uncertainty" has "slowed the pace and level of client spending, particularly for smaller contracts with a shorter duration and for our consulting services."
The TRUE side's growth narrative relies entirely on managed services (up 4%) and forward revenue projections of $74–78 billion. But managed services contracts convert to revenue over years, not quarters, and carry structurally lower margins than the consulting work they are replacing. A consulting-led firm where consulting is shrinking is undergoing a mix shift toward lower-margin, longer-duration work — a transition that merits a lower multiple, not a higher one.
The TRUE side offered no direct rebuttal to the argument that generative AI and intensifying competition from the Big Four and Indian IT services firms are compressing Accenture's pricing power. This silence is telling. Accenture's own MD&A concedes that "we continue to experience lower pricing across the business." When a company simultaneously faces technological disruption of its core service model — AI automating the very tasks consultants bill for — and pricing pressure from well-capitalized competitors, its long-term return on invested capital faces structural headwinds. The TRUE side's assertion that AI adoption represents a tailwind conflates demand for AI implementation services (which may benefit Accenture) with the deflationary impact of AI on the cost of delivering those services (which threatens margins). Both forces operate simultaneously, and the net effect on profitability is far from certain.
The FALSE side overstated the valuation case in Round 1 by mischaracterizing the forward P/E multiple. The TRUE side's correction on this point was accurate, well-sourced, and materially strengthened their position. If the debate were scored solely on Round 1, the TRUE side would have the stronger showing.
However, the FALSE side's two remaining pillars — the documented contraction in core consulting and the structural threat to Accenture's competitive moat — went entirely unrebutted across three rounds. These are not peripheral concerns; they strike at the heart of whether Accenture can sustain the earnings growth that its valuation, even at 13x forward, requires for meaningful capital appreciation. A stock that looks cheap on forward estimates can still destroy capital if those estimates are revised downward — and the revision trend, the consulting contraction, and the competitive pressures all point in that direction.
The debate ultimately turns on whether one believes the forward estimates will materialize. The FALSE side has demonstrated that the trajectory of the underlying business, the direction of analyst revisions, and the structural pressures on Accenture's pricing power all argue against that outcome. The TRUE side has shown that if the estimates do materialize, the stock appears reasonably valued. On balance, the preponderance of evidence favors caution — and a cautious stance on a stock that must execute flawlessly to justify its current price is, by definition, a case against it as a compelling vehicle for long-term capital appreciation.
The case against Accenture as a compelling long-term capital appreciation vehicle rests on three converging axes: a valuation premium unsupported by decelerating growth, a business model structurally threatened by AI commoditization , and direct macro-political headwinds eroding a critical revenue segment. After three rounds of debate, the evidence favors the negative position.
The affirmative's strongest claim — that Accenture trades at an "attractive" or merely "in-line" valuation — collapses under scrutiny of the forward data. The stock trades at approximately 21.5x forward earnings, but consensus EPS growth is only 7.0–7.4% over the next two fiscal years, yielding a PEG ratio of ~2.9–3.1x. This is expensive by any standard; growth-oriented investors typically demand PEG below 1.0. Revenue growth is projected at just 5.3–6.3% — nowhere near the "double-digit" expansion the affirmative asserts.
| Metric | FY2025A | FY2026E | FY2027E | CAGR (FY25–FY27) |
|---|---|---|---|---|
| Revenue (B) | 69.7 | 74.1 | 78.0 | +5.8% |
| EPS | 12.93 | 13.88 | $14.91 | +7.4% |
| Revenue Growth | +7.0% | +6.3% | +5.3% | Decelerating |
| EPS Growth | +8.1% | +7.3% | +7.4% | Flat/Decelerating |
Legend: Accenture consensus estimates (FY2025 actual, FY2026–FY2027 consensus). Revenue in USD billions; growth rates in percent; CAGR = compound annual growth rate. Source: analyst consensus estimates, May 2026.
Critically, the analyst revision trend is turning negative. For Q4 FY2026, consensus EPS has been revised from 3.35 to 3.29 (60-day trend), with 17 downward revisions versus only 1 upward in the last 30 days — a 17:1 down-to-up ratio. For Q1 FY2027, EPS growth is projected at a mere 0.6% (2.84 vs. 2.82 year-ago). The affirmative's claim of "accelerating" earnings growth is contradicted by the actual data: growth is decelerating or flattening, not accelerating.
The affirmative argues that Accenture's 800,000-strong workforce and client relationships constitute a "durable competitive moat ." This confuses scale with defensibility. Accenture's model is fundamentally a labor-arbitrage operation: it bills premium rates for knowledge work performed by consultants. Generative AI commoditizes exactly this output — code generation, document drafting, data analysis, process design. The company's own FY2025 10-K records 615 million in business optimization costs, including 344M for a "refreshed talent strategy" and $271M in asset impairments from divesting acquisitions "no longer aligned with strategic priorities." This is not a company riding the AI wave; it is a company restructuring under AI pressure.
The affirmative's counter — that Accenture is itself generating AI-related revenue — is incomplete. AI revenue remains a fraction of the total, and the structural risk is that AI-native competitors and client self-service erode the demand for large-scale, people-heavy consulting engagements. Consulting revenue grew only 5% in local currency in FY2025 versus 9% for managed services — the higher-margin, human-intensive segment is already the slower-growth one. Over a long-term horizon, this divergence will widen.
Accenture's own management explicitly warns in its FY2025 10-K that U.S. federal government spending reduction efforts under DOGE are causing "delays in new procurements, reductions in price and contract scope, and contract terminations" at Accenture Federal Services. Management further states these changes "could in the future have a material impact on our results." The Health & Public Service industry group generated $14.8B in FY2025 revenue (21% of total). Combined with a persistently constrained discretionary spending environment — management acknowledges "significant economic and geopolitical uncertainty" and that "the discretionary environment is unchanged" — this creates a multi-front macro risk that is difficult to diversify away, particularly when consulting (50% of revenue) is the most cyclically exposed segment.
The affirmative raises two points that deserve acknowledgment. First, the observation that Accenture's forward P/E has compressed from post-pandemic highs and now roughly aligns with the S&P 500 multiple is factually correct — but it is insufficient. Being "in line" with the index is not a bull case when the company's growth profile (5–7%) significantly trails the S&P 500's expected EPS growth of 10–12%. Second, the argument that buybacks amplify genuinely solid per-share growth rather than masking weakness has partial merit — Accenture does generate robust free cash flow ($9–10B annually) and has best-in-class ROIC among IT services peers. However, this does not address the core issue: organic revenue growth of 5–6% cannot sustain a P/E of 21.5x over the long term without multiple expansion, and the downward revision trend signals that even the 7% EPS growth consensus may prove optimistic.
The affirmative's case rests on a cyclical rebound thesis — that current weakness is temporary and growth will re-accelerate. But the data does not support this: bookings declined 1% in FY2025, near-term quarterly EPS estimates are being revised down (not up), and Q1 FY2027 EPS growth is projected at essentially zero. The "durable moat" narrative ignores the structural AI threat to labor-arbitrage consulting. The macro tailwind argument is directly contradicted by management's own disclosures about federal spending cuts and a persistently weak discretionary environment. At a PEG of ~3x, with decelerating growth and downward estimate revisions, Accenture offers inadequate compensation for the risks it faces. The stock is not a compelling long-term capital appreciation vehicle — it is a mature, decelerating business priced for a re-acceleration that the forward data does not confirm.
| Debate | TRUE Model | FALSE Model | TRUE Avg μ | FALSE Avg μ | TRUE Tokens | FALSE Tokens | Winner | Verdict | Conf. |
|---|---|---|---|---|---|---|---|---|---|
| #1 | moonshotai/kimi-k2.6 | accounts/fireworks/models/deepseek-v4-pro | 0.424 | 0.259 | 51 | 18 | TRUE | TRUE | 75% |
| #2 | moonshotai/kimi-k2.6 | accounts/fireworks/models/glm-5p1 | 0.000 | 0.000 | 51 | 18 | TRUE | FALSE | 75% |
The following technical terms, abbreviations, and domain-specific concepts are referenced throughout this debate transcript. Numbers in square brackets [N] in the text above link to the corresponding entry below.
[1] accretive capital allocation — The use of corporate funds (e.g., share buybacks, acquisitions) in a way that increases earnings per share or intrinsic value per share, often by repurchasing undervalued stock.
[2] AI commoditization — artificial intelligence commoditization — The process by which AI tools become widely available and standardized, reducing their premium value and pricing power for specialized service providers.
[3] competitive moat — A company's sustainable competitive advantage that protects it from rivals and preserves long-term profitability, such as high switching costs or unique expertise.
[4] consulting revenues — Income generated from providing expert advice and implementation services, typically higher-margin and shorter-cycle than managed services.
[5] digital core modernization — Updating a company's central technology infrastructure—such as enterprise resource planning (ERP) systems—to improve efficiency and enable new capabilities like cloud and AI.
[6] diluted EPS — diluted earnings per share — Net income divided by the number of shares outstanding after considering all potential dilutive securities (stock options, convertibles), measuring per-share profitability.
[7] ecosystem partnerships — Strategic alliances with technology providers (e.g., cloud platforms like AWS, Azure) that enhance a consulting firm's service offerings and create mutual dependencies.
[8] financial engineering — The use of corporate finance strategies (e.g., share repurchases, debt restructuring) to alter financial metrics such as earnings per share without changing underlying operations.
[9] fiscal consolidation — Government policies aimed at reducing budget deficits and public debt, often through spending cuts or tax increases, which can reduce demand for consulting services.
[10] foreign exchange headwinds — Negative impacts on reported financial results caused by unfavorable currency exchange rate movements, reducing revenue or earnings when translated to the reporting currency.
[11] fortress balance sheet — A financial position characterized by high liquidity, low debt, and strong equity, providing resilience during economic downturns and enabling continued investment.
[12] forward P/E — forward price-to-earnings ratio — A valuation ratio calculated using projected future earnings (usually the next fiscal year) divided by the current share price, indicating expected earnings growth.
[13] generative AI — generative artificial intelligence — Artificial intelligence models that can create new content (text, images, code) based on training data, potentially automating tasks previously done by consultants.
[14] global delivery capability — The ability to provide services across multiple geographic locations using a distributed workforce, enabling scale and cost efficiency for multinational clients.
[15] industry groups — Segments within a company organized by client industry (e.g., Financial Services, Health & Public Service), used to report revenue and focus expertise.
[16] large language models — large language models (LLMs) — AI models trained on vast text data that can understand and generate human-like language, potentially disrupting traditional consulting tasks like documentation and analysis.
[17] macroeconomic climate — The overall state of the economy, including factors such as growth, inflation, interest rates, and employment, which influence corporate spending and investment decisions.
[18] managed services — Ongoing operational services provided by a vendor under long-term contracts with recurring revenue, typically lower-margin but more stable than consulting.
[19] multiple compression — A decline in a stock's valuation ratio (e.g., price-to-earnings) relative to its earnings or other fundamentals, often due to deteriorating growth prospects.
[20] non-discretionary spending — Expenditures that businesses or consumers must make regardless of economic conditions (e.g., regulatory compliance, digital core maintenance), providing revenue stability.
[21] operating income — Profit from core business operations after deducting operating expenses but before interest and taxes, a key measure of operational profitability.
[22] organic growth — Revenue or profit expansion generated internally through existing operations, excluding acquisitions, divestitures, or accounting effects like share repurchases.
[23] premium multiple — A valuation ratio (e.g., P/E) higher than historical averages or industry peers, reflecting expectations of superior future performance or competitive advantages.
[24] price-to-earnings ratio — P/E ratio — A valuation metric comparing a company's current share price to its earnings per share, used to assess whether a stock is overvalued or undervalued.
[25] pricing pressure — Competitive forces that force a company to lower its prices, reducing profit margins, often due to overcapacity, commoditization, or aggressive rivals.
[26] return on invested capital — ROIC — A profitability measure showing how efficiently a company generates returns from its invested capital (debt and equity), indicating long-term value creation.
[27] share repurchases — share repurchases (buybacks) — A company buying its own shares from the market, reducing the number of shares outstanding and mechanically increasing earnings per share.
[28] stockholders' equity — The residual interest in a company's assets after deducting liabilities, representing the owners' stake and a measure of financial strength.
[29] switching costs — The expenses, inconvenience, or risks a customer incurs when changing from one vendor to another, creating loyalty and pricing power for the incumbent.
[30] trailing P/E — trailing price-to-earnings ratio — A valuation ratio calculated using actual earnings from the past 12 months divided by the current share price, reflecting historical performance.
[31] value trap — A stock that appears undervalued based on low P/E or other metrics but is actually in structural decline, failing to generate future appreciation.
[32] year-over-year — YoY — A comparison of financial data for the same period in consecutive years, used to assess growth trends while controlling for seasonality.
The following financial data tables were referenced during the debate exchanges:
| Fiscal Year | Revenue | Net Income | Diluted EPS |
|---|---|---|---|
| FY2022 | $61.6B | $6.88B | $10.71 |
| FY2023 | $64.1B | $6.87B | $10.77 |
| FY2024 | $64.9B | $7.26B | $11.44 |
Legend: Accenture plc annual financial summary (FY2022–FY2024). Revenue and net income in USD billions; EPS in USD per share. Source: SEC 10-K filings.
</FinancialData>
| Metric | FY2022 | FY2023 | FY2024 |
|---|---|---|---|
| Revenue ($B) | $61.6 | $64.1 | $64.9 |
| Operating Income ($B) | $9.37 | $8.81 | $9.60 |
| Diluted EPS | $10.71 | $10.77 | $11.44 |
| Revenue Growth (YoY) | — | +4.1% | +1.2% |
Legend: Accenture revenue, operating income, and diluted EPS for fiscal years 2022–2024. Revenue growth decelerated sharply from FY2023 to FY2024. Source: SEC 10-K filings.
</FinancialData>
| Period | Upward Revisions (30d) | Downward Revisions (30d) | Net Direction |
|---|---|---|---|
| May 2026 Quarter | 7 | 12 | −5 (Bearish) |
| Aug 2026 Quarter | 1 | 17 | −16 (Bearish) |
| FY2026 Annual | 1 | 1 | 0 (Neutral) |
| FY2027 Annual | 2 | 3 | −1 (Bearish) |
Legend: Analyst EPS estimate revisions for Accenture over the last 30 days, by reporting period. Downward revisions dominate near-term quarters, signaling deteriorating confidence in the earnings trajectory. Source: consensus estimate data.
</FinancialData>
| P/E Type | EPS Basis | Valuation Multiple |
|---|---|---|
| Trailing (FY2024) | $11.44 reported | 15.7x |
| Forward (FY2026E) | $13.88 consensus | 12.9x |
| Forward (FY2027E) | $14.91 consensus | 12.0x |
Legend: Accenture P/E multiples at a share price of ~$179. FY2024 actual per SEC filing; FY2026–FY2027 consensus estimates. Source: company filings and sell-side estimates as of May 2026.
</FinancialData>
| Metric | FY2023 | FY2024 | FY2025 | YoY Change (FY25 vs FY24) |
|---|---|---|---|---|
| Revenue ($B) | $64.1 | $64.9 | $69.7 | +7.0% |
| Operating Margin | 13.7% | 14.8% | 14.7% | -10 bps |
| Net Income ($B) | $6.87 | $7.26 | $7.68 | +5.7% |
| New Bookings ($B) | $83.0 | $81.2 | $80.6 | -1.0% |
| Diluted EPS | $10.77 | $11.44 | $12.15 | +6.2% |
Legend: Accenture key financial metrics for fiscal years ending August 31. Revenue and income in USD billions; margins in percent; YoY change calculated from reported figures. Source: Accenture 10-K filings.
</FinancialData>
| Period | Current EPS Est. | 30 Days Ago | 60 Days Ago | 90 Days Ago | Direction |
|---|---|---|---|---|---|
| Q3 FY2026 (May) | $3.73 | $3.73 | $3.73 | $3.71 | Down from 60d |
| Q4 FY2026 (Aug) | $3.29 | $3.29 | $3.35 | $3.35 | Down from 60d |
| FY2026 (Aug) | $13.88 | $13.88 | $13.86 | $13.82 | Down from 90d |
| FY2027 (Aug) | $14.91 | $14.91 | $14.91 | $14.90 | Flat/Down |
Legend: Consensus EPS estimates for Accenture across near-term horizons. All figures in USD per share. Direction column indicates net trend vs. prior periods. Source: analyst consensus estimates as of May 2026.
</FinancialData>
| Fiscal Year | Diluted EPS | YoY Growth |
|---|---|---|
| FY2022 | $10.82 | — |
| FY2023 | $11.33 | +4.7% |
| FY2024 | $11.96 | +5.6% |
| FY2025 | $12.93 | +8.1% |
| FY2026E | $13.88 | +7.3% |
| FY2027E | $14.91 | +7.4% |
Legend: Accenture annual diluted EPS (FY2022–FY2025 actual, FY2026–FY2027 consensus estimate). Growth in percent. Source: SEC filings and analyst consensus.
</FinancialData>
| Metric | Value |
|---|---|
| Current Price (May 25, 2026) | $179.24 |
| Consensus Price Target | $247.55 |
| Implied Upside | +38.1% |
| Analyst Rating | Buy (1.82/5.0) |
| Number of Analysts | 26 |
Legend: Accenture analyst consensus data as of May 25, 2026. Rating scale: 1=Strong Buy, 5=Strong Sell. Source: equity estimates consensus.
</FinancialData>
| Metric | FY2025A | FY2026E | FY2027E | CAGR (FY25–FY27) |
|---|---|---|---|---|
| Revenue ($B) | $69.7 | $74.1 | $78.0 | +5.8% |
| EPS | $12.93 | $13.88 | $14.91 | +7.4% |
| Revenue Growth | +7.0% | +6.3% | +5.3% | Decelerating |
| EPS Growth | +8.1% | +7.3% | +7.4% | Flat/Decelerating |
Legend: Accenture consensus estimates (FY2025 actual, FY2026–FY2027 consensus). Revenue in USD billions; growth rates in percent; CAGR = compound annual growth rate. Source: analyst consensus estimates, May 2026.
</FinancialData>
Debate Transcripts
- ■
Ownership & Trade Secrets. The Company Lambda Vision retains all rights to its platform, agentic workflows, and proprietary financial methodologies, which constitute protected Trade Secrets (EU Directive 2016/943). Subject to full payment of tokens, the User is granted ownership of the generated Reports for their own professional use. Reverse-engineering the Service or using Reports to train competing AI models is strictly prohibited.
- ■
No Financial Advice. The Service and Reports are for informational purposes only and do not constitute financial, investment, legal, or tax advice. The Company is not a regulated financial advisor. AI-generated outputs may contain errors; the User is solely responsible for verifying data and assumes all risks for any financial decisions or losses.
- ■
Liability & Governing Law. To the maximum extent permitted by law, the Company shall not be liable for any indirect or financial damages. These Terms are governed by French law. Any disputes shall be subject to the exclusive jurisdiction of the Courts of Paris, France.