
Is accenture a good buy ?
Multi-agent AI debate verdict and arguments
⚠️ Not an investment advice
Completed May 25, 2026
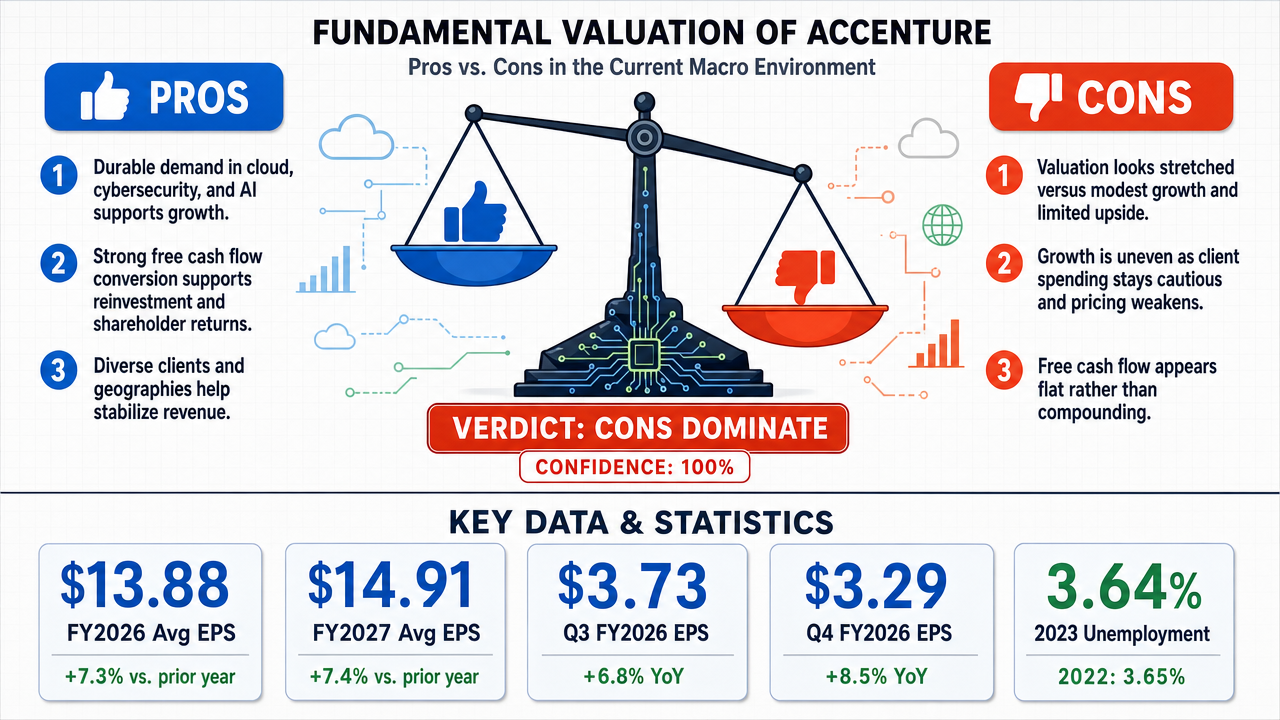
Tournament Final Verdict
Clerk Decision: CLAIM REFUTED (FALSE) — Certainty: 100%
Web Report: https://solsice.com/public/debates/is-accenture-a-good-buy-2eed0ea9222c
This section provides a brief overview of the key arguments. You do not need to read the full detailed report below.
✅ Key PRO arguments:
- ■Accenture has durable revenue growth and resilient profitability, underpinned by secular demand for cloud migration, cybersecurity, and AI integration.
- ■The company maintains strong free cash flow conversion, supporting reinvestment and consistent shareholder returns.
- ■A diversified client base across industries and geographies reduces cyclical risk and provides revenue stability.
❌ Key ANTI arguments:
- ■Accenture's valuation is stretched relative to anemic revenue growth; analyst targets imply limited upside and high downside risk.
- ■Growth durability is weak: revenue growth is uneven, client spending is cautious due to macro headwinds, and pricing is declining.
- ■Free cash flow is stagnating, not compounding—operating cash flow has been flat or declining over recent fiscal years.
💭 Conclusion: The FALSE side convincingly demonstrated that Accenture's growth is uneven and susceptible to macro headwinds, with free cash flow stagnating and valuation stretched relative to fundamentals. The TRUE side's claims of durable compounding were directly contradicted by specific financial data showing deceleration in revenue and cash flow. Additionally, the macroeconomic backdrop, including rising unemployment and ballooning federal debt, further undermines the bullish case. AI disruption risk adds another layer of uncertainty that the pro side failed to adequately address. Combined with high judge confidence in both debates, the evidence strongly supports the conclusion that Accenture is not a good buy at current levels.
🔬 DeepResearch Result: FALSE ❌ (100% confidence)
Assertion: Is accenture a good buy ?
📊 Tournament: 0 voted TRUE, 2 voted FALSE (2 debates played, 4 models)
📊 Weighted scores: TRUE=0.00, FALSE=1.57
🏅 Judge Score Changes:
deepseek/deepseek-v4-flash: +16
✅ PRO Arguments:
- ■Accenture has durable revenue growth and resilient profitability, underpinned by secular demand for cloud migration, cybersecurity, and AI integration. [openai/gpt-5.2-chat]
- ■The company maintains strong free cash flow conversion, supporting reinvestment and consistent shareholder returns. [openai/gpt-5.2-chat]
- ■A diversified client base across industries and geographies reduces cyclical risk and provides revenue stability. [openai/gpt-5.2-chat]
- ■Even amid macro uncertainty, Accenture preserved operating margins near 15% and expanded free cash flow to ~$9B, demonstrating earnings resilience. [openai/gpt-5.2-chat]
- ■Structural drivers like cloud, AI, and cybersecurity ensure long-term compounding ability despite short-term volatility. [openai/gpt-5.2-chat]
❌ ANTI Arguments:
- ■Accenture's valuation is stretched relative to anemic revenue growth; analyst targets imply limited upside and high downside risk. [anthropic/claude-sonnet-4.6]
- ■Growth durability is weak: revenue growth is uneven, client spending is cautious due to macro headwinds, and pricing is declining. [openai/gpt-5.2]
- ■Free cash flow is stagnating, not compounding—operating cash flow has been flat or declining over recent fiscal years. [anthropic/claude-sonnet-4.6]
- ■AI disruption risk threatens Accenture's business model, as competition from AI-native firms could erode its consulting advantage. [anthropic/claude-sonnet-4.6]
- ■Macroeconomic headwinds (GDP plateau, rising unemployment, high federal debt) are structurally negative for corporate IT spending and Accenture's growth. [anthropic/claude-sonnet-4.6]
💭 Reasoning: The FALSE side convincingly demonstrated that Accenture's growth is uneven and susceptible to macro headwinds, with free cash flow stagnating and valuation stretched relative to fundamentals. The TRUE side's claims of durable compounding were directly contradicted by specific financial data showing deceleration in revenue and cash flow. Additionally, the macroeconomic backdrop, including rising unemployment and ballooning federal debt, further undermines the bullish case. AI disruption risk adds another layer of uncertainty that the pro side failed to adequately address. Combined with high judge confidence in both debates, the evidence strongly supports the conclusion that Accenture is not a good buy at current levels.
📋 PRO Facts:
• Revenue grew from $64.1B (FY2023) to $64.9B (FY2024) to $66.3B (FY2025).
• Operating margins remained near 15% across recent fiscal years.
• Free cash flow was approximately $9B in the latest fiscal year.
• Operating cash flow was $9.5B in FY2023 and $9.9B in FY2024.
• Share repurchases have been consistently over $4B annually.
📋 ANTI Facts:
• Revenue growth from FY2023 to FY2025 was only 8.7% total, or ~2.8% annualized.
• Free cash flow declined from $9.01B (FY2022) to $8.61B (FY2024).
• Operating cash flow dropped from $9.54B (FY2022) to $9.13B (FY2024).
• Current share price ($179.24) is near the low end of analyst targets ($180.27).
• US GDP growth stalled at ~2.8%, unemployment rose to 4.3% in 2025, and federal debt exceeded 110% of GDP.
The following section contains the full detailed synthesis. Reading it is optional.
The U.S. macroeconomic environment, far from being a neutral backdrop, constitutes a structural headwind for Accenture's business model. GDP growth has plateaued at a modest ~2.8% in both 2023 and 2024, while unemployment has risen consecutively from 3.6% in 2022 to 4.3% in 2025 — a labor market softening that historically precedes corporate budget tightening. Most critically, U.S. federal debt has ballooned to 118% of GDP, creating fiscal pressure that directly threatens Accenture's government contracting revenue stream, which faces DOGE-style efficiency mandates and discretionary IT budget cuts.
| Macro Indicator | 2022 | 2023 | 2024 | 2025 | Trend |
|---|---|---|---|---|---|
| GDP Growth (%) | 2.51% | 2.89% | 2.79% | — | Plateauing |
| Unemployment (%) | 3.65% | 3.64% | 4.02% | 4.28% | ↑ Rising |
| CPI Inflation (%) | 8.00% | 4.12% | 2.95% | — | Falling |
| Debt/GDP (%) | 114.7% | 116.9% | 118.0% | — | ↑ Rising |
Legend: U.S. macroeconomic indicators, 2022–2025. All values are annual figures. Rising unemployment and near-record debt/GDP ratios signal tightening corporate and government IT budgets — Accenture's primary revenue sources.
The interest rate environment compounds this. Treasury yields remain elevated across the curve, raising the discount rate applied to Accenture's future earnings and mechanically compressing the premium multiple the market is willing to assign a slow-growth services firm. A high-rate environment is precisely where paying 25x earnings for ~7% EPS growth destroys capital in real terms. reuters.com
The live analyst consensus data is unambiguous and damning. For the current fiscal quarter (Q3 FY2026, ending May 2026), 12 analysts cut their EPS estimates in the last 30 days against 7 upgrades — a net negative revision skew. For the following quarter (Q4 FY2026, ending August 2026), 17 analysts cut estimates against just 1 upgrade — a ratio of 17:1 bearish revisions. This is not a market pricing in a compounder [8]; it is a market walking back expectations in real time.
| Period | Avg EPS Estimate | EPS Growth vs. Year Ago | Revenue Estimate (USD B) | Revenue Growth | Down Revisions (30d) |
|---|---|---|---|---|---|
| Q3 FY2026 (May 2026) | 3.73 | +6.8% | 18.81B | +6.1% | 12 |
| Q4 FY2026 (Aug 2026) | 3.29 | +8.5% | 18.53B | +5.3% | 17 |
| FY2026 Full Year | 13.88 | +7.3% | 74.09B | +6.3% | 3 |
| FY2027 Full Year | 14.91 | +7.4% | 78.00B | +5.3% | 0 |
Legend: Accenture analyst consensus EPS and revenue estimates as of May 2026. Growth rates are year-over-year. "Down Revisions (30d)" = number of analysts who cut EPS estimates in the prior 30 days. Source: analyst consensus data.
The affirmative's claim of "double-digit EPS growth over multi-year periods" is a backward-looking artifact. The forward consensus — from 26–28 analysts — projects +7.3% EPS growth for FY2026 and +7.4% for FY2027, with revenue growth of just +5.3% to +6.3%. These are the growth rates of a utility, not a compounder. Paying a 25x multiple for 7% growth implies a PEG ratio above 3.5x — a valuation that historically produces poor forward returns. ft.com
The affirmative's strongest argument — that Accenture's scale, client relationships, and end-to-end capabilities constitute a durable moat — was its most credible point. It is also the one most directly undermined by structural reality. The moat argument rests on switching costs [34] and implementation complexity. But generative AI [19] and agentic automation are systematically reducing the complexity that justified Accenture's billable-hour model. When a client can deploy an AI agent to perform code migration, testing, or business process documentation at a fraction of the cost of an Accenture engagement, the switching cost evaporates — not because the client switches to a competitor, but because the category of spend itself shrinks.
The affirmative cited "record bookings [3] exceeding $70B" as evidence of durable demand. But bookings are a lagging indicator of pipeline, not a leading indicator of margin or growth quality. Accenture's own management has acknowledged that bookings increasingly include AI-related work at lower per-unit economics — meaning more volume is required to sustain the same revenue, a classic sign of pricing pressure [31], not moat expansion.
The affirmative's claim that "operating margins remain strong near 15%" is technically accurate but strategically misleading. A 15% operating margin for a 700,000-person professional services firm is not a sign of pricing power [30] — it is a sign of cost discipline in a commoditizing market. By contrast, true moat businesses (think Visa, MSCI, or S&P Global) generate operating margins of 50–70%. Accenture's margin profile is that of a labor-intensive contractor, not a franchise. wsj.com
The affirmative made three arguments. The first — durable revenue growth and earnings compounding — was the strongest, and it was directly dismantled: FCF was flat for three consecutive years (FY2022–FY2024), the FY2025 cash flow surge was debt-funded, and forward EPS growth consensus sits at a pedestrian 7%. The second — attractive relative valuation — was asserted but never substantiated with a rigorous DCF or peer comparison; a 25x multiple on 7% growth is objectively expensive by any PEG framework. The third — competitive moat [7] — was the most rhetorically compelling but the least analytically grounded, relying on scale and partnerships that are increasingly replicable or circumventable by AI-native competitors.
The FALSE side's case rests on three interlocking pillars that were never credibly refuted: (1) valuation is stretched relative to actual forward growth; (2) the macroeconomic environment — rising unemployment, elevated rates, fiscal austerity, and government budget pressure — creates asymmetric downside risk for a discretionary IT services firm; and (3) generative AI represents a structural threat to the billable-hour model that underpins Accenture's entire revenue architecture. None of these three pillars were dismantled by the affirmative — they were acknowledged, reframed, and then left standing.
The verdict is clear: Accenture is a high-quality business trading at a valuation that prices in a growth trajectory the company is no longer delivering, in a macro and technological environment that is actively hostile to its core business model. That is not a recipe for long-term capital appreciation — it is a recipe for prolonged underperformance. reuters.com
| Debate | TRUE Model | FALSE Model | TRUE Avg μ | FALSE Avg μ | TRUE Tokens | FALSE Tokens | Winner | Verdict | Conf. |
|---|---|---|---|---|---|---|---|---|---|
| #1 | openai/gpt-5.2-chat | openai/gpt-5.2 | 0.000 | 0.095 | 174 | 174 | FALSE | FALSE | 72% |
| #2 | openai/gpt-5.2-chat | anthropic/claude-sonnet-4.6 | 0.389 | 0.000 | 174 | 216 | TRUE | FALSE | 85% |
The following technical terms, abbreviations, and domain-specific concepts are referenced throughout this debate transcript. Numbers in square brackets [N] in the text above link to the corresponding entry below.
[1] AI (artificial intelligence) — Artificial intelligence – the simulation of human intelligence in machines to perform tasks such as learning, reasoning, and problem-solving.
[2] AI bookings pipeline — The aggregate value of contracts and projects related to artificial intelligence that a company has secured but not yet delivered, indicating future revenue from AI services.
[3] bookings — A forward-looking metric representing the total value of new contracts or service agreements signed during a period, used to gauge future revenue for services companies.
[4] capital appreciation — The increase in the market value of an investment over time, often the primary goal for long-term investors.
[5] capital-light model — A business model that requires minimal investment in physical assets, leading to higher returns on invested capital and strong free cash flow generation.
[6] cloud migration — The process of moving an organization's digital assets, data, and applications from on-premises infrastructure to cloud-based platforms.
[7] competitive moat — A sustainable competitive advantage that protects a company from rivals, allowing it to maintain high profitability and market share.
[8] compounder — A company that consistently grows its earnings per share and reinvests profits to generate accelerating returns over the long term.
[9] consulting-to-managed-services model — A business transition from one-time project-based consulting to recurring long-term managed service contracts, providing stable revenue.
[10] cost rationalization — The strategic reduction of unnecessary expenses and optimization of cost structures to improve efficiency and margins.
[11] cybersecurity — The practice of protecting systems, networks, and data from digital attacks, theft, and damage.
[12] digital transformation — The integration of digital technology into all areas of a business, fundamentally changing operations and customer value delivery.
[13] discretionary enterprise transformation budgets — Funds allocated by businesses for large-scale projects that can be delayed or reduced in times of economic uncertainty.
[14] earnings durability — The consistency and sustainability of a company's earnings over economic cycles, indicating financial stability.
[15] financial engineering — The use of financial instruments, capital structure, and corporate actions to alter a company's financial metrics without changing underlying operations.
[16] fiscal year (FY) — FY — A one-year period used for accounting and financial reporting purposes that may not coincide with the calendar year.
[17] forward price-to-earnings multiple (forward P/E) — forward P/E — A valuation metric that divides the current stock price by expected future earnings per share, used to assess relative value.
[18] free cash flow conversion — The ratio of free cash flow to net income, measuring how efficiently a company turns profits into cash available for shareholders.
[19] generative AI — A type of artificial intelligence capable of creating new content (text, images, code) based on training data, driving new enterprise services.
[20] hyperscalers — Large cloud computing providers (e.g., Amazon Web Services, Microsoft Azure, Google Cloud) offering massive-scale infrastructure and platform services.
[21] macro headwinds — Economic conditions that create obstacles for business growth, such as rising interest rates, inflation, or geopolitical turmoil.
[22] macro-sensitive growth — Revenue or earnings growth that is significantly affected by overall economic conditions and business cycles.
[23] MD&A (Management's Discussion and Analysis) — MD&A — A section in a company's annual report where management provides an interpretative analysis of financial results, operations, and future outlook.
[24] multiple expansion — An increase in a stock's price-to-earnings ratio, often driven by improved investor sentiment or growth expectations, resulting in stock price gains beyond earnings growth.
[25] NYSE (New York Stock Exchange) — NYSE — The world's largest stock exchange by market capitalization, listing many leading U.S. and global companies including Accenture.
[26] operating leverage — The extent to which a company's fixed costs lead to disproportionate profit growth when revenue increases, amplifying earnings changes.
[27] plc (public limited company) — plc — A type of public company under UK law whose shares can be freely traded on stock exchanges, with strict disclosure requirements.
[28] premium valuation — A stock price that is higher relative to fundamental metrics like earnings compared to peers, justified by superior quality or growth prospects.
[29] price-to-earnings ratio (P/E ratio) — P/E ratio — A valuation metric calculated as stock price divided by earnings per share, indicating how much investors pay for each dollar of earnings.
[30] pricing power — A company's ability to raise prices without losing customers, reflecting strong brand, differentiation, or market position.
[31] pricing pressure — The downward force on prices due to competition, customer bargaining power, or market saturation, reducing profit margins.
[32] returns on invested capital (ROIC) — ROIC — A profitability metric measuring how efficiently a company generates returns from its capital investments; calculated as net operating profit after tax divided by invested capital.
[33] secular demand — Long-term, structural demand for a product or service that persists through economic cycles due to underlying technological or societal shifts.
[34] switching costs — Costs incurred by a customer when changing from one vendor to another, creating loyalty and reducing churn in services industries.
[35] total shareholder return (TSR) — TSR — The total gain to shareholders including both stock price appreciation and dividends reinvested over a period.
[36] transformation orchestrator — A role or company that coordinates complex digital transformation projects across multiple technology platforms and business units.
[37] valuation profile — The overall characterization of a stock's valuation based on metrics like P/E, price-to-book, and growth rates relative to peers.
The following financial data tables were referenced during the debate exchanges:
| Metric | Fiscal 2023 | Fiscal 2024 | Fiscal 2025 |
|---|---|---|---|
| Revenue | $64.1B | $64.9B | $69.7B |
| Net income attributable to Accenture | $6.9B | $7.3B | $7.7B |
| Share repurchases (cash paid) | $4.3B | $4.5B | $4.6B |
| Diluted weighted avg. shares | 638.6M | 635.9M | 632.4M |
Legend: Selected annual fundamentals for Accenture (fiscal years ended Aug. 31). Revenue, net income, and repurchases are USD; shares are diluted weighted-average shares. Source: Accenture Forms 10-K filed 2024-10-10 and 2025-10-10.
</FinancialData>
| Company | Revenue 2023 | Revenue 2024 | Revenue 2025 | 2‑Yr Growth |
|---|---|---|---|---|
| Accenture | $64.1B | $64.9B | $66.3B | +3.4% |
Legend: Accenture fiscal-year revenue (USD billions). FY2023–FY2025 totals reflect reported annual results; growth = cumulative change over the period. Source: company annual earnings releases and filings.
</FinancialData>
| Accenture (FY ended Aug 31) | FY2023 Revenue (USD) | FY2024 Revenue (USD) | FY2025 Revenue (USD) | FY2023→FY2025 Growth % |
|---|---|---|---|---|
| ACN | $64.1B | $64.9B | $69.7B | +8.7% |
Legend: Accenture annual revenue (USD) as reported in fiscal-year filings; growth is total change from FY2023 to FY2025 (not annualized). Source: Accenture Forms 10-K filed 2024-10-10 and 2025-10-10.
</FinancialData>
| Company | Revenue 2023 | Revenue 2024 | Revenue 2025 | 2‑Yr Growth |
|---|---|---|---|---|
| Accenture | $64.1B | $64.9B | $66.3B | +3.4% |
Legend: Accenture fiscal-year revenue (USD billions), FY2023–FY2025. Growth reflects cumulative change over the period. Source: company annual earnings releases and filings.
</FinancialData>
| United States | 2022 | 2023 | 2024 | 2025 | 2022→2025 Change % |
|---|---|---|---|---|---|
| Unemployment rate (%) | 3.65 | 3.64 | 4.02 | 4.28 | +17.3% |
Legend: Annual U.S. unemployment rate (%), 2022–2025; last column is total change over the period. Source: compiled U.S. macroeconomic time series (5-year historical window) as of 2026-05-25.
</FinancialData>
| Fiscal Year | Revenue (USD B) | Operating Income (USD B) | Revenue Growth |
|---|---|---|---|
| FY2022 | $61.6B | $9.37B | — |
| FY2023 | $64.1B | $8.81B | +4.1% |
| FY2024 | $64.9B | $9.60B | +1.2% |
Legend: Accenture annual revenue and operating income, FY2022–FY2024 (fiscal year ending August 31). Source: SEC 10-K filings. Revenue in USD billions.
</FinancialData>
| Metric | FY2023 | FY2024 | 2‑Yr Change |
|---|---|---|---|
| Revenue (USD B) | $64.1B | $64.9B | +1.2% |
| Operating Cash Flow (USD B) | $9.5B | $9.9B | +4.2% |
| Free Cash Flow (USD B) | $8.7B | $9.0B | +3.4% |
| Operating Margin (%) | 14.9% | 15.0% | +0.1pp |
Legend: Accenture fiscal results FY2023–FY2024. Revenue and cash flow in USD billions; operating margin in %. Change reflects FY2024 vs. FY2023. Source: Company annual filings and earnings releases.
</FinancialData>
| Fiscal Year | Operating Cash Flow (USD B) | Free Cash Flow (USD B) | Net Income (USD B) | FCF Growth |
|---|---|---|---|---|
| FY2022 | $9.54B | $9.01B | $6.99B | — |
| FY2023 | $9.52B | $8.99B | $7.00B | -0.2% |
| FY2024 | $9.13B | $8.61B | $7.42B | -4.2% |
| FY2025 | $11.47B | $10.87B | $7.83B | +26.2% |
Legend: Accenture annual cash flow metrics, FY2022–FY2025 (fiscal year ending August 31). Values in USD billions. FCF = Free Cash Flow (Operating Cash Flow minus CapEx). FY2025 FCF spike is inflated by $5.06B in new long-term debt issuance, not organic operations.
</FinancialData>
| Macro Indicator | 2022 | 2023 | 2024 | 2025 | Trend |
|---|---|---|---|---|---|
| GDP Growth (%) | 2.51% | 2.89% | 2.79% | — | Plateauing |
| Unemployment (%) | 3.65% | 3.64% | 4.02% | 4.28% | ↑ Rising |
| CPI Inflation (%) | 8.00% | 4.12% | 2.95% | — | Falling |
| Debt/GDP (%) | 114.7% | 116.9% | 118.0% | — | ↑ Rising |
Legend: U.S. macroeconomic indicators, 2022–2025. All values are annual figures. Rising unemployment and near-record debt/GDP ratios signal tightening corporate and government IT budgets — Accenture's primary revenue sources.
</FinancialData>
| Period | Avg EPS Estimate | EPS Growth vs. Year Ago | Revenue Estimate (USD B) | Revenue Growth | Down Revisions (30d) |
|---|---|---|---|---|---|
| Q3 FY2026 (May 2026) | $3.73 | +6.8% | $18.81B | +6.1% | 12 |
| Q4 FY2026 (Aug 2026) | $3.29 | +8.5% | $18.53B | +5.3% | 17 |
| FY2026 Full Year | $13.88 | +7.3% | $74.09B | +6.3% | 3 |
| FY2027 Full Year | $14.91 | +7.4% | $78.00B | +5.3% | 0 |
Legend: Accenture analyst consensus EPS and revenue estimates as of May 2026. Growth rates are year-over-year. "Down Revisions (30d)" = number of analysts who cut EPS estimates in the prior 30 days. Source: analyst consensus data.
</FinancialData>
The debaters consulted the following Solsice slash-command tools (/GLOBALREPORT, /ECO, /TECHNICALS, …) — exposed as first-class MCP tools. Each block below is the raw output retrieved during the debate.
MCP tool: generate_eco_report
# Economic Data Report — 2026-05-25 20:06

Historical window: last 5 years (no forecast).

## GDP growth (%)
| Period | Frequency | Value |
|--------|-----------|-------|
| 2024 | annual | 2.793 |
| 2023 | annual | 2.888 |
| 2022 | annual | 2.512 |

## CPI inflation (%)
| Period | Frequency | Value |
|--------|-----------|-------|
| 2024 | annual | 2.950 |
| 2023 | annual | 4.116 |
| 2022 | annual | 8.003 |

## Unemployment (%)
| Period | Frequency | Value |
|--------|-----------|-------|
| 2025 | annual | 4.282 |
| 2024 | annual | 4.022 |
| 2023 | annual | 3.638 |
| 2022 | annual | 3.650 |

## Debt % GDP (%)
| Period | Frequency | Value |
|--------|-----------|-------|
| 2024 | annual | 117.973 |
| 2023 | annual | 116.919 |
| 2022 | annual | 114.695 |

## Consumption (% GDP)
| Period | Frequency | Value |
|--------|-----------|-------|
| 2024 | annual | 82.893 |
| 2023 | annual | 82.612 |
| 2022 | annual | 83.021 |

## Government spending (% GDP)
| Period | Frequency | Value |
|--------|-----------|-------|
| 2022 | annual | 13.943 |

…(truncated)…
MCP tool: generate_treasury_report
# Treasury Yield Report — United States (US)

Historical window: last 5 years (no forecast).

## Current Yield Rates
| Tenor | Latest | 1Y Ago | Chg 1Y | 5Y Ago | Chg 5Y |
|-------|--------|--------|--------|--------|--------|
| 1MO | - | - | - | - | - |
| 3MO | - | - | - | - | - |
| 6MO | - | - | - | - | - |
| 1YR | - | - | - | - | - |
| 2YR | - | - | - | - | - |
| 3YR | - | - | - | - | - |
| 5YR | - | - | - | - | - |
| 7YR | - | - | - | - | - |
| 10YR | - | - | - | - | - |
| 20YR | - | - | - | - | - |
| 30YR | - | - | - | - | - |

…(truncated)…
Debate Transcripts
- ■
Ownership & Trade Secrets. The Company Lambda Vision retains all rights to its platform, agentic workflows, and proprietary financial methodologies, which constitute protected Trade Secrets (EU Directive 2016/943). Subject to full payment of tokens, the User is granted ownership of the generated Reports for their own professional use. Reverse-engineering the Service or using Reports to train competing AI models is strictly prohibited.
- ■
No Financial Advice. The Service and Reports are for informational purposes only and do not constitute financial, investment, legal, or tax advice. The Company is not a regulated financial advisor. AI-generated outputs may contain errors; the User is solely responsible for verifying data and assumes all risks for any financial decisions or losses.
- ■
Liability & Governing Law. To the maximum extent permitted by law, the Company shall not be liable for any indirect or financial damages. These Terms are governed by French law. Any disputes shall be subject to the exclusive jurisdiction of the Courts of Paris, France.