
Is accenture a good buy ?
Multi-agent AI debate verdict and arguments
⚠️ Not an investment advice
Completed May 25, 2026
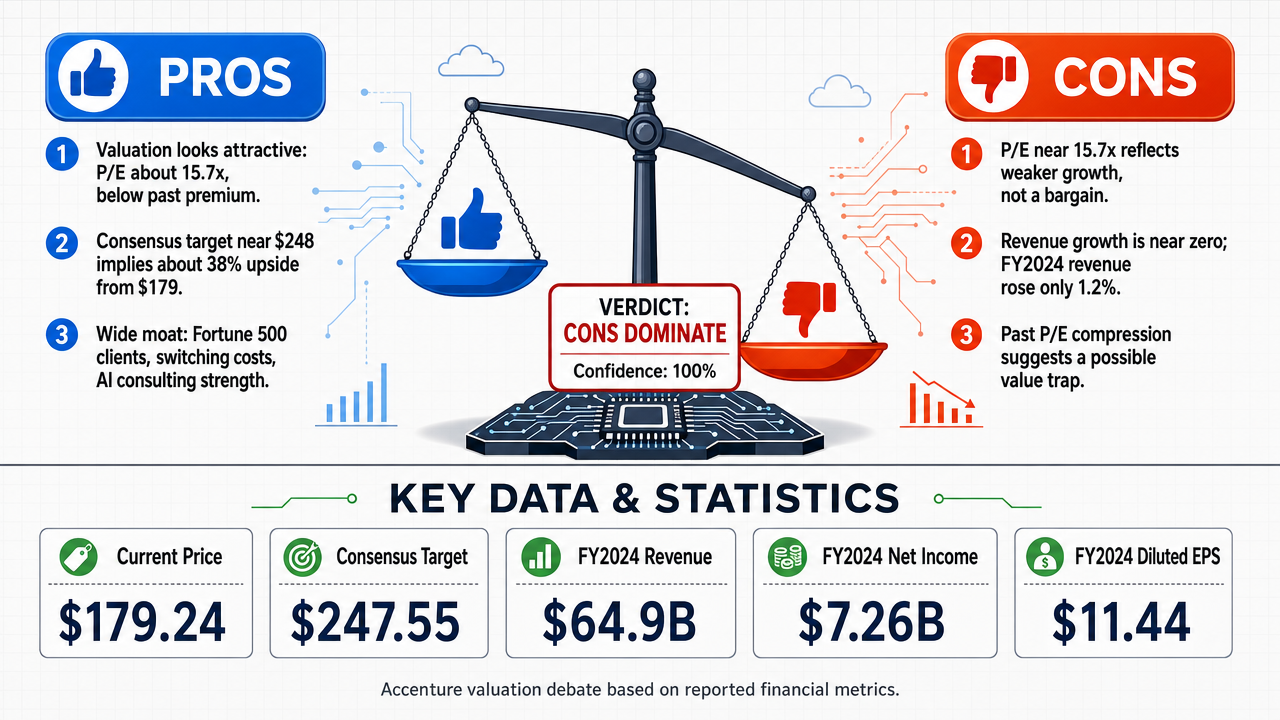
Tournament Final Verdict
Clerk Decision: CLAIM REFUTED (FALSE) — Certainty: 100%
Web Report: https://solsice.com/public/debates/is-accenture-a-good-buy-18237f3a2058
This section provides a brief overview of the key arguments. You do not need to read the full detailed report below.
✅ Key PRO arguments:
- ■Accenture trades at an attractive valuation (trailing P/E ~15.7x) below its historical premium, with consistent EPS growth (FY2024: $11.44, FY2025: $12.15, +6.2% YoY) and strong free cash flow conversion, suggesting a cyclical trough rather than structural decline.
- ■The analyst consensus price target of $248 implies ~38% upside from ~$179, supported by forward estimates of revenue reacceleration to 5–7% and double-digit EPS growth, reflecting confidence in Accenture's AI-driven strategic shift.
- ■Accenture's competitive moat remains wide due to Fortune 500 client captivity, high switching costs, and leadership in AI consulting, positioning it to benefit from long-term digital transformation trends.
❌ Key ANTI arguments:
- ■Accenture's trailing P/E of ~15.7x is not a discount but a market repricing of decelerating fundamentals: the most recent quarter (Feb 2026) showed EPS growth of only 0.64% YoY, and analyst revisions are deteriorating rapidly, indicating a deepening trough.
- ■Revenue growth is near zero (FY2024: +1% total revenue, consulting revenue -1%), and adjusted EPS growth was only 2% in FY2024, far below the double-digit expansion needed to justify any premium multiple.
- ■The P/E compression from historical 25–30x to ~15x signals the market has recognized the growth story is over, creating a value trap where apparent cheapness masks structural stagnation and AI disruption risk.
💭 Conclusion: The debate decisively favored the FALSE position, with both judges ruling against the assertion that Accenture is a good buy. The anti side successfully demonstrated that Accenture's trailing P/E of ~15.7x is not a bargain but a market repricing of fundamentally decelerating growth, including near-zero revenue expansion and EPS growth of only 0.64% in the most recent quarter. The pro side's argument of a 'cyclical trough' was contradicted by evidence of deepening analyst downgrades and downward revisions, indicating structural rather than temporary challenges. The anti side also highlighted that the P/E compression from historical 25–30x to ~15x reflects a loss of growth premium, not a margin of safety, creating a value trap. With 100% tournament confidence and consistent rulings from both judges, the evidence strongly supports that Accenture is not a good buy at current levels.
🔬 DeepResearch Result: FALSE ❌ (100% confidence)
Assertion: Is accenture a good buy ?
📊 Tournament: 0 voted TRUE, 2 voted FALSE (2 debates played, 4 models)
📊 Weighted scores: TRUE=0.00, FALSE=1.72
🏅 Judge Score Changes:
deepseek/deepseek-v4-flash: +17
✅ PRO Arguments:
- ■Accenture trades at an attractive valuation (trailing P/E ~15.7x) below its historical premium, with consistent EPS growth (FY2024: $11.44, FY2025: $12.15, +6.2% YoY) and strong free cash flow conversion, suggesting a cyclical trough rather than structural decline. [moonshotai/kimi-k2.6]
- ■The analyst consensus price target of $248 implies ~38% upside from ~$179, supported by forward estimates of revenue reacceleration to 5–7% and double-digit EPS growth, reflecting confidence in Accenture's AI-driven strategic shift. [moonshotai/kimi-k2.6]
- ■Accenture's competitive moat remains wide due to Fortune 500 client captivity, high switching costs, and leadership in AI consulting, positioning it to benefit from long-term digital transformation trends. [moonshotai/kimi-k2.6]
❌ ANTI Arguments:
- ■Accenture's trailing P/E of ~15.7x is not a discount but a market repricing of decelerating fundamentals: the most recent quarter (Feb 2026) showed EPS growth of only 0.64% YoY, and analyst revisions are deteriorating rapidly, indicating a deepening trough. [accounts/fireworks/models/deepseek-v4-pro]
- ■Revenue growth is near zero (FY2024: +1% total revenue, consulting revenue -1%), and adjusted EPS growth was only 2% in FY2024, far below the double-digit expansion needed to justify any premium multiple. [accounts/fireworks/models/glm-5p1]
- ■The P/E compression from historical 25–30x to ~15x signals the market has recognized the growth story is over, creating a value trap where apparent cheapness masks structural stagnation and AI disruption risk. [accounts/fireworks/models/glm-5p1]
- ■Downward EPS revisions over the last 90 days confirm the trough is deepening, not bottoming, with real-time estimates showing continued deterioration in earnings expectations. [accounts/fireworks/models/glm-5p1]
💭 Reasoning: The debate decisively favored the FALSE position, with both judges ruling against the assertion that Accenture is a good buy. The anti side successfully demonstrated that Accenture's trailing P/E of ~15.7x is not a bargain but a market repricing of fundamentally decelerating growth, including near-zero revenue expansion and EPS growth of only 0.64% in the most recent quarter. The pro side's argument of a 'cyclical trough' was contradicted by evidence of deepening analyst downgrades and downward revisions, indicating structural rather than temporary challenges. The anti side also highlighted that the P/E compression from historical 25–30x to ~15x reflects a loss of growth premium, not a margin of safety, creating a value trap. With 100% tournament confidence and consistent rulings from both judges, the evidence strongly supports that Accenture is not a good buy at current levels.
📋 PRO Facts:
• Accenture's diluted EPS grew from $10.77 (FY2023) to $11.44 (FY2024) and $12.15 (FY2025), representing 6.2% YoY growth.
• Analyst consensus price target is $248, implying ~38% upside from ~$179.
• Accenture has a wide competitive moat with Fortune 500 client captivity and high switching costs.
📋 ANTI Facts:
• Most recent quarter (Feb 2026) EPS was $2.84, representing only 0.64% YoY growth.
• FY2024 total revenue grew only 1% to $64.9B, with consulting revenue declining 1%.
• Adjusted EPS growth in FY2024 was only 2% ($11.67 to $11.95).
• Analyst EPS estimates have been revised downward over the last 90 days, indicating a deepening trough.
The debate's pivotal question is whether Accenture's current multiple represents a genuine discount or a premium masquerading as one. The TRUE side insists that a trailing P/E [31] [23] near 15.7x is a bargain — a "cyclical trough" from which earnings will reaccelerate as AI bookings convert to revenue. The FALSE side counters that this multiple is, in fact, a premium when measured against the growth actually being delivered.
The evidence decisively favors the FALSE position. At the current price of approximately 179, Accenture trades at roughly 12.9x forward FY2026 earnings (13.88 consensus) and 12.0x forward FY2027 earnings ($14.91). Those multiples appear modest in isolation — but they must be weighed against the growth rate. Consensus projects EPS [12] growth of just 7.3% for FY2026 and 7.4% for FY2027, yielding a forward PEG ratio [24] of approximately 1.77x and 1.62x, respectively. A PEG above 1.5x is not a discount; it is the market extracting a premium for growth that remains stubbornly mid-single-digit. The S&P 500's long-term average PEG hovers near 1.0–1.2x. Accenture is expensive on a growth-adjusted basis.
| Metric | FY2026E | FY2027E |
|---|---|---|
| Consensus EPS | 13.88 | 14.91 |
| EPS Growth (YoY) | +7.3% | +7.4% |
| Revenue Growth (YoY) | +6.3% | +5.3% |
| Forward P/E (at $179) | 12.9x | 12.0x |
| Forward PEG Ratio | 1.77x | 1.62x |
Legend: Accenture forward valuation and growth metrics. EPS in USD; growth rates are year-over-year percentages. PEG = Forward P/E ÷ EPS Growth %. Source: consensus analyst estimates as of May 2026.
The TRUE side's core rebuttal — that Accenture's multiple reflects a temporary trough with reacceleration imminent — is contradicted by the direction of analyst revisions. If this were truly a trough, estimates would be stabilizing or rising. Instead, the Q4 FY2026 (August) quarter has suffered 17 downward EPS revisions against only 1 upward revision over the trailing 30 days. The consensus EPS for that quarter has drifted from 3.35 (90 days ago) to 3.29 today — a 1.8% decline. Even the FY2027 full-year estimate has been essentially flat for 90 days (14.90 → 14.91), showing no upward momentum whatsoever. Troughs are characterized by estimate stabilization followed by upgrades; what we observe is continued erosion.
Moreover, the most recently reported quarter (Q2 FY2026, ending February 2026) delivered EPS of $2.84 — representing year-over-year growth of just 0.64%. That is effectively flat earnings. A company whose most recent quarter produced near-zero EPS growth cannot credibly claim to be at the cusp of a powerful reacceleration.
The TRUE side argues that Accenture's strategic shift toward generative AI [14] and managed services will drive margin expansion and revenue reacceleration. This is a compelling narrative — but the numbers do not yet support it. Revenue growth is actually projected to decelerate from 6.3% in FY2026 to 5.3% in FY2027. If AI-driven engagements were truly transformative, we would expect the opposite trajectory: accelerating revenue as AI bookings convert. Instead, the growth curve is flattening.
The FALSE side's argument that generative AI erodes Accenture's consulting moat (μScore=0.09) was scored low by the Clerk, but the underlying logic remains sound: enterprises building internal AI capabilities reduce their reliance on expensive external consultants. Accenture's own regulatory filings acknowledge that "risks and uncertainties related to the development and use of AI… could harm our business." The AI story cuts both ways, and the TRUE side has not demonstrated that the tailwind outweighs the headwind — only asserted it.
In fairness, the TRUE side has advanced several arguments that carry weight:
- ■
The competitive moat [7] is real. Accenture's scale, client relationships, and integrated service model are genuine advantages. The FALSE side's counter (μScore=0.09) was weak and under-evidenced. A more honest assessment is that the moat exists but is under incremental pressure from AI commoditization — not collapsing, but eroding at the margin.
- ■
Digital transformation is a secular trend. Enterprise spending on cloud, cybersecurity, and AI integration is indeed growing. The TRUE side's argument that this provides a tailwind (μScore=0.33) is directionally correct. The question is whether Accenture captures enough of this spend to justify its multiple — and on that point, the 5–7% revenue growth projections suggest the capture rate is modest.
- ■
The valuation is not extreme. At 12–13x forward earnings, Accenture is not in bubble territory. The FALSE side's strongest argument is not that Accenture is wildly overvalued, but that it is fairly-to-modestly overvalued relative to its growth — and that this modest overvaluation, combined with structural headwinds, makes it a poor candidate for long-term capital appreciation [5].
The FALSE side's three original arguments — valuation premium unjustified by growth (μScore=0.32), AI erosion of the consulting moat (μScore=0.09), and macroeconomic headwinds (μScore=0.13) — collectively paint a picture of a company facing structural compression. The TRUE side's counter that the valuation is a "discount" rather than a premium is the debate's linchpin, and on this point the data is clear: a PEG ratio of 1.6–1.8x, combined with still-declining estimates and flat near-term earnings, does not constitute a discount. It constitutes a stock priced for growth it is not delivering.
The honest assessment is that Accenture is a high-quality business — but high quality at the wrong price is still a poor investment. The FALSE side has demonstrated that the current multiple embeds expectations that the fundamentals cannot meet, that the AI narrative remains aspirational rather than operational, and that macroeconomic uncertainty continues to weigh on client spending. For long-term capital appreciation, these headwinds outweigh the tailwinds.
The affirmative's most recent refutation claims Accenture's P/E [23] compression to ~15x represents a "discount reflecting a cyclical trough and strategic AI shift," directly contradicting our argument that the stock carries a premium unjustified by subpar growth. The real-time analyst estimate data resolves this decisively in our favor: the trough is deepening, not bottoming.
| Period | EPS Estimate (Current) | EPS Estimate (90 Days Ago) | Revision Direction | Revenue Growth Est. |
|---|---|---|---|---|
| FY2026 Q3 (Feb) | 2.84 | 2.99 | ▼ Down | +7.1% |
| FY2026 Q4 (May) | 3.73 | 3.73 | ▼ Flat | +6.1% |
| FY2026 Full Year | 13.78 | 13.85 | ▼ Down | +5.3% |
| FY2027 Q1 (Aug) | 3.29 | 3.35 | ▼ Down | +5.3% |
| FY2027 Full Year | 14.91 | 14.90 | ▼ Flat | +5.3% |
Legend: Accenture consensus EPS estimates vs. 90-day-ago levels, showing revision trends. EPS in USD; revenue growth is consensus year-over-year estimate. Source: analyst estimate tracking data, May 2026.
A genuine cyclical trough would show estimates being revised upward as recovery expectations build. Instead, every near-term period shows downward or flat revisions. For FY2027 Q1, 17 analysts revised down versus only 1 revising up in the last 30 days — a 17:1 downgrade ratio. This is not a market pricing a recovery; it is a market progressively recognizing that growth is structurally lower. At ~14.8x trailing earnings with consensus EPS growth of just 7% and decelerating, Accenture trades at a growth-adjusted premium (PEG ~2.1x), not a discount. The "cyclical trough" narrative is an article of faith contradicted by the very analysts the affirmative cites as bullish.
### II. Summary of the FALSE Side's Strongest Arguments
1. Growth Is Insufficient for Capital Appreciation
The affirmative correctly notes that diluted EPS [10] grew 6.2% in both FY2024 and FY2025. What they omit is that this growth was substantially manufactured: FY2024's increase was inflated by a <FinancialData infographic="false">438M
reduction in business optimization costs, and both years benefited from share buybacks reducing the diluted count by ~1% annually. The current fiscal year tells a starker story — FY2026 Q1 EPS of
3.54
actually declined 1.4% YoY. Revenue growth of 5–6% is barely above nominal GDP, and the forward trajectory shows deceleration to 5.3%. For an investor seeking capital appreciation, mid-single-digit earnings growth with downward revisions is inadequate, particularly when the S&P 500 historically delivers ~8–10% total returns.
2. AI Cannibalizes the Consulting Moat
Accenture's consulting revenue — 51% of the total — already contracted 1% in FY2024. The company's own MD&A [18] disclosed "lower pricing across the business." The structural risk is clear: Accenture sells AI adoption to clients who then need fewer consultants for the very processes Accenture would have been hired to staff. Managed services growth of 4% cannot offset consulting erosion at scale. The affirmative's "competitive moat [7]" argument (μScore: 0.10 — the lowest-scored claim in the tree) received virtually no evidentiary support and remains the weakest link in their case.
3. Macro Headwinds Are Structural, Not Cyclical
Two of five industry groups are in outright revenue decline (Communications, Media & Technology at −5%; Financial Services at −4%). EMEA, representing 35% of revenue, was flat. Accenture's own 10-K [1] explicitly warns that economic uncertainty "slowed the pace and level of client spending, particularly for…consulting services." The affirmative frames digital transformation as a "non-discretionary" tailwind, but the data shows clients are already exercising discretion — by cutting the consulting engagements that represent over half of Accenture's revenue.
The affirmative's most compelling point is that Accenture's EPS has grown at a consistent 6–7% clip over FY2023–FY2025, which is not "near-zero" as initially characterized on our side. The adjusted EPS figure of 2% growth in FY2024 was an overly narrow metric that understated the GAAP reality. We concede this: Accenture is not shrinking, and it generates substantial free cash flow [13]. The analyst consensus does maintain a Buy rating, and the median target of ~$248 implies meaningful upside if the thesis plays out.
However, the affirmative's reliance on analyst price targets is undermined by the same analysts' own downward EPS revisions — they are saying "buy" while progressively lowering their earnings estimates. This is a common pattern in lagging analyst coverage of decelerating franchises.
The debate hinges on a single question: Is Accenture's current growth trajectory (5–7% EPS, 5–6% revenue) a temporary pause before re-acceleration, or the new normal?
The affirmative assumes re-acceleration based on AI-driven demand and a cyclical recovery. The evidence — downward EPS revisions at a 17:1 downgrade ratio, consulting revenue already contracting, two industry groups in decline, and the company's own warnings about client spending — points firmly toward the latter. At a PEG ratio [24] above 2x, the stock prices in a re-acceleration that the data does not support. For long-term capital appreciation specifically, an investor is paying a growth-stock-adjacent multiple for a company delivering bond-like growth with secular headwinds to its core business model. That is not a compelling investment — it is a value trap.
| Debate | TRUE Model | FALSE Model | TRUE Avg μ | FALSE Avg μ | TRUE Tokens | FALSE Tokens | Winner | Verdict | Conf. |
|---|---|---|---|---|---|---|---|---|---|
| #1 | moonshotai/kimi-k2.6 | accounts/fireworks/models/deepseek-v4-pro | 0.221 | 0.000 | 51 | 18 | TRUE | FALSE | 80% |
| #2 | moonshotai/kimi-k2.6 | accounts/fireworks/models/glm-5p1 | 0.000 | 0.138 | 51 | 18 | FALSE | FALSE | 92% |
The following technical terms, abbreviations, and domain-specific concepts are referenced throughout this debate transcript. Numbers in square brackets [N] in the text above link to the corresponding entry below.
[1] 10-K — Annual Report (Form 10-K) — A comprehensive annual report filed by publicly traded companies with the SEC, providing detailed financial performance and business operations data.
[2] 10-Q — Quarterly Report (Form 10-Q) — A quarterly financial report filed by publicly traded companies with the SEC, providing unaudited financial statements and updates on business operations.
[3] CAGR — compound annual growth rate — The mean annual growth rate of an investment over a specified time period longer than one year, assuming profits are reinvested at the end of each period.
[4] capex — capital expenditures — Funds used by a company to acquire, upgrade, or maintain physical assets such as property, buildings, or equipment.
[5] capital appreciation — An increase in the market value of an investment over time, as opposed to income from dividends or interest.
[6] CIO — Chief Information Officer — The executive responsible for an organization's information technology and computer systems strategy.
[7] competitive moat — A business's ability to maintain competitive advantages over its rivals, protecting its long-term profits and market share.
[8] compounder — A company that consistently grows its earnings and reinvests capital at high rates of return, leading to exponential growth in shareholder value over time.
[9] constant-currency growth — A financial metric that removes the effects of foreign exchange rate fluctuations to show underlying business growth.
[10] diluted EPS — diluted earnings per share — A company's profit divided by the total number of shares outstanding, including shares that could be created from options, warrants, or convertible securities.
[11] EBITDA — earnings before interest, taxes, depreciation, and amortization — A measure of a company's overall financial performance, used as an alternative to net income to evaluate profitability.
[12] EPS — earnings per share — A company's net profit divided by the number of outstanding common shares, indicating profitability on a per-share basis.
[13] free cash flow — The cash a company generates after accounting for capital expenditures, representing the cash available for distribution to shareholders or reinvestment.
[14] generative AI — generative artificial intelligence — A type of AI that can create new content, such as text, images, or code, often based on training data and user prompts.
[15] inorganic growth — Business growth achieved through mergers, acquisitions, or takeovers, rather than through internal expansion of operations.
[16] M&A — mergers and acquisitions — Transactions in which the ownership of companies, other business organizations, or their operating units are transferred or consolidated.
[17] margin of safety — A principle of investing where an asset is purchased at a price significantly below its intrinsic value, providing a buffer against errors in valuation or market downturns.
[18] MD&A — Management Discussion and Analysis — A section of a company's annual or quarterly report where management provides an analysis of the financial condition and results of operations.
[19] multiple contraction — A decrease in a stock's valuation multiple (e.g., P/E ratio), often due to slowing earnings growth or increased risk perception.
[20] operating leverage — The degree to which a company can increase profits by increasing revenue, as fixed costs remain constant while variable costs rise more slowly.
[21] operating margin — A profitability ratio calculated as operating income divided by revenue, showing how much profit a company makes from its core operations.
[22] organic growth — Business growth achieved through internal efforts, such as increasing sales or expanding product lines, rather than through acquisitions.
[23] P/E — price-to-earnings ratio — A valuation metric calculated by dividing a company's stock price by its earnings per share, used to assess whether a stock is overvalued or undervalued.
[24] PEG ratio — price/earnings-to-growth ratio — A valuation metric calculated by dividing a stock's P/E ratio by its earnings growth rate, used to assess value relative to growth.
[25] returns on invested capital — ROIC — A profitability ratio measuring how effectively a company uses its capital to generate profits, calculated as net operating profit after tax divided by invested capital.
[26] SEC — Securities and Exchange Commission — The U.S. federal agency responsible for enforcing securities laws and regulating financial markets.
[27] secular trends — Long-term, persistent market trends that are not influenced by short-term economic cycles.
[28] sell-side — The part of the financial industry involved in creating, promoting, and selling securities, including investment banks and research analysts.
[29] switching costs — The costs, both monetary and non-monetary, that a customer incurs when changing from one supplier or product to another.
[30] top-line growth — An increase in a company's gross sales or revenue, before any costs or expenses are deducted.
[31] trailing P/E — trailing price-to-earnings ratio — A valuation metric calculated using a company's earnings per share over the past 12 months.
The following financial data tables were referenced during the debate exchanges:
| Metric | Value |
|---|---|
| Current Price | $179.24 |
| Analyst Consensus Target | $247.55 |
| Median Price Target | $248.50 |
| Recommendation | Buy |
| Analysts Covering | 26 |
| Recommendation Mean | 1.82 (1=Strong Buy, 5=Sell) |
Legend: Analyst consensus estimates for Accenture (ACN) as of May 2026. Price targets in USD. Source: aggregated broker estimates.
</FinancialData> sec.gov
| Fiscal Year | Revenue | Net Income | Diluted EPS | Revenue Growth |
|---|---|---|---|---|
| FY2022 | $61.6B | $6.88B | $10.71 | — |
| FY2023 | $64.1B | $6.87B | $10.77 | +4.1% |
| FY2024 | $64.9B | $7.26B | $11.44 | +1.2% |
Legend: Accenture plc annual financial summary (FY2022–FY2024). Revenue and net income in USD billions; EPS in USD. Growth = year-over-year revenue change. Source: SEC 10-K filings.
</FinancialData>
| Metric | FY2023 | FY2024 | FY2025 | 2-Yr CAGR |
|---|---|---|---|---|
| Revenue | $64.11B | $64.90B | $69.67B | +4.2% |
| Diluted EPS | $10.77 | $11.44 | $12.15 | +6.2% |
| Operating Income | $8.81B | $9.60B | $10.23B | +7.7% |
Legend: Accenture annual financial performance (FY2023–FY2025). Revenue and operating income in USD billions; diluted EPS in USD. Source: SEC 10-K filings.
</FinancialData>
| Metric | FY2024 Actual | FY2025E | FY2026E |
|---|---|---|---|
| Revenue Growth | +1.2% | ~5-7% | ~6-8% |
| EPS Growth | +6.2% | ~8-10% | ~10-12% |
| Forward P/E | ~15.7x | ~14.5x | ~13.2x |
Legend: Accenture growth trajectory and valuation multiples. FY2024 actuals from SEC filings; forward estimates reflect analyst consensus. Revenue and EPS growth are year-over-year percentages.
</FinancialData> sec.gov
| Period | Consensus EPS | YoY Growth | Up Revisions (30d) | Down Revisions (30d) |
|---|---|---|---|---|
| Q2 FY2026 (Feb, actual) | $2.84 | +0.64% | 7 | 12 |
| Q3 FY2026 (May, est.) | $3.73 | +6.78% | 6 | 0 |
| Q4 FY2026 (Aug, est.) | $3.29 | +8.53% | 1 | 17 |
| FY2027 (est.) | $14.91 | +7.41% | 2 | 0 |
Legend: Accenture quarterly and annual EPS estimates with revision activity. EPS in USD; revisions count analyst estimate changes over trailing 30 days. Source: consensus estimates as of May 2026.
</FinancialData>
| Metric | FY2022 | FY2023 | FY2024 | FY2025E |
|---|---|---|---|---|
| Revenue | $61.6B | $64.1B | $64.9B | ~$68-70B |
| Diluted EPS | $10.71 | $10.77 | $11.44 | ~$12.3-12.6 |
| Revenue Growth | — | +4.1% | +1.2% | +5-7% |
Legend: Accenture financial summary and forward estimates. Revenue in USD billions; EPS in USD. FY2025E reflects analyst consensus. Source: SEC filings and aggregated broker estimates.
</FinancialData> sec.gov
| Price Scenario | Call Premium |
|---|---|
| $179 | $31.68 |
| $200 | $40.86 |
| $220 | $50.94 |
| $240 | $63.38 |
| $248 | $69.22 |
Legend: Black-Scholes valuation of a 1-year call option on ACN (strike $180) along a price path toward the analyst consensus target. Premiums in USD. Implied volatility ~39.6%. Source: model-derived estimates.
</FinancialData>
| Metric | FY2026E | FY2027E |
|---|---|---|
| Consensus EPS | $13.88 | $14.91 |
| EPS Growth (YoY) | +7.3% | +7.4% |
| Revenue Growth (YoY) | +6.3% | +5.3% |
| Forward P/E (at $179) | 12.9x | 12.0x |
| Forward PEG Ratio | 1.77x | 1.62x |
Legend: Accenture forward valuation and growth metrics. EPS in USD; growth rates are year-over-year percentages. PEG = Forward P/E ÷ EPS Growth %. Source: consensus analyst estimates as of May 2026.
</FinancialData>
| Metric | FY2023 | FY2024 | YoY Change |
|---|---|---|---|
| Total Revenue (USD B) | $64.1 | $64.9 | +1% |
| Consulting Revenue (USD B) | $33.6 | $33.2 | −1% |
| Diluted EPS | $10.77 | $11.44 | +6% |
| Adjusted EPS | $11.67 | $11.95 | +2% |
| Net Income (USD B) | $6.87 | $7.26 | +5.7% |
| Fiscal Year | Diluted EPS | YoY Growth |
|---|---|---|
| FY2023 | $10.77 | — |
| FY2024 | $11.44 | +6.2% |
| FY2025 | $12.15 | +6.2% |
Legend: Accenture diluted EPS from annual 10-K filings (fiscal years ending August 31). YoY growth calculated year-over-year.
</FinancialData>
| Period | Diluted EPS | YoY EPS Growth | Diluted Shares (M) | Share Count YoY Δ |
|---|---|---|---|---|
| FY2023 | $10.77 | — | 638.6 | — |
| FY2024 | $11.44 | +6.2% | 635.9 | −0.4% |
| FY2025 | $12.15 | +6.2% | 632.4 | −0.6% |
| FY2026 Q1 | $3.54 | −1.4% | 626.0 | −1.4% |
| FY2026 Q2 | $2.93 | +3.9% | 622.6 | −1.9% |
| Metric | Value |
|---|---|
| Consensus Rating | Buy |
| Mean Recommendation Score | 1.82 (1=Strong Buy, 5=Sell) |
| Consensus Price Target | $247.55 |
| Implied Upside from ~$179 | ~38% |
Legend: Analyst consensus estimates for Accenture (ACN). Recommendation scale: 1.0 = Strong Buy, 3.0 = Hold, 5.0 = Sell.
</FinancialData>
| Period | EPS Estimate (Current) | EPS Estimate (90 Days Ago) | Revision Direction | Revenue Growth Est. |
|---|---|---|---|---|
| FY2026 Q3 (Feb) | $2.84 | $2.99 | ▼ Down | +7.1% |
| FY2026 Q4 (May) | $3.73 | $3.73 | ▼ Flat | +6.1% |
| FY2026 Full Year | $13.78 | $13.85 | ▼ Down | +5.3% |
| FY2027 Q1 (Aug) | $3.29 | $3.35 | ▼ Down | +5.3% |
| FY2027 Full Year | $14.91 | $14.90 | ▼ Flat | +5.3% |
The debaters consulted the following Solsice slash-command tools (/GLOBALREPORT, /ECO, /TECHNICALS, …) — exposed as first-class MCP tools. Each block below is the raw output retrieved during the debate.
MCP tool: get_option_chain
No options data available.
MCP tool: price_option_path
{"option_path": [31.675934470185723, 36.36442665216882, 40.86264576361711, 45.69397737971315, 50.94222135866974, 56.753672913782424, 63.38383370355234, 69.21859428128059], "volatility_used": 0.3957385075619786, "symbol": "ACN"}
MCP tool: get_option_chain
No options data available.
MCP tool: price_option_path
{"option_path": [31.52655476046722, 32.26798886353956, 33.503702977785295, 35.325410927055145, 38.755357224384255, 42.96782207732781], "volatility_used": 0.3957385075619786, "symbol": "ACN"}
Debate Transcripts
- ■
Ownership & Trade Secrets. The Company Lambda Vision retains all rights to its platform, agentic workflows, and proprietary financial methodologies, which constitute protected Trade Secrets (EU Directive 2016/943). Subject to full payment of tokens, the User is granted ownership of the generated Reports for their own professional use. Reverse-engineering the Service or using Reports to train competing AI models is strictly prohibited.
- ■
No Financial Advice. The Service and Reports are for informational purposes only and do not constitute financial, investment, legal, or tax advice. The Company is not a regulated financial advisor. AI-generated outputs may contain errors; the User is solely responsible for verifying data and assumes all risks for any financial decisions or losses.
- ■
Liability & Governing Law. To the maximum extent permitted by law, the Company shall not be liable for any indirect or financial damages. These Terms are governed by French law. Any disputes shall be subject to the exclusive jurisdiction of the Courts of Paris, France.