
Connecticut's Gini coefficient of approximately 0.50 accurately reflects the state's overall economic inequality.
AI debate verdict and arguments
⚠️ AI-generated information only; not professional advice
Completed October 24, 2026
Verdict
Verdict: likely FALSE (70%)
Web Report: https://solsice.com/public/debates/connecticut-s-gini-coefficient-of-approximately-0-50-accurat-5b84f4076d69
This section provides a brief overview of the key arguments. You do not need to read the full detailed report below.
✅ Key PRO arguments:
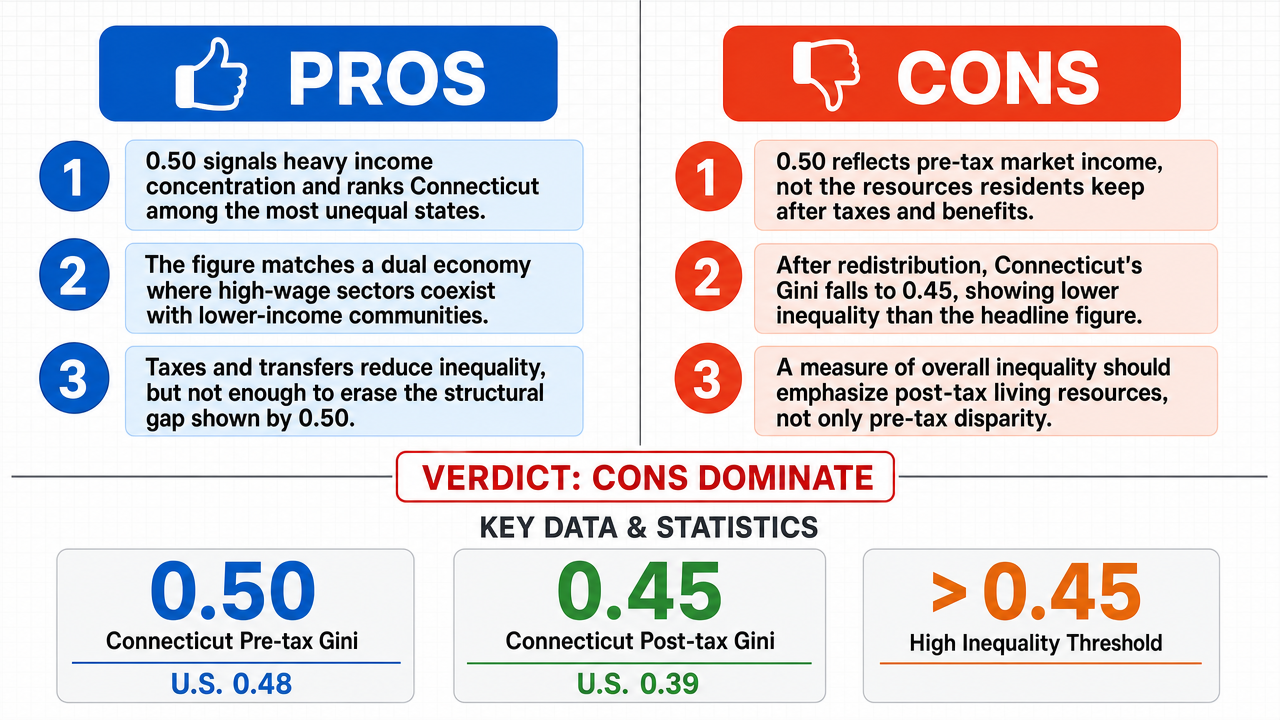
- ■A Gini coefficient of approximately 0.50 is a mathematically robust indicator of heavy income concentration , placing Connecticut among the most unequal states in the nation on a scale where 0 represents perfect equality and 1 represents perfect inequality.
- ■The 0.50 figure is not an outlier but a precise reflection of Connecticut's dual economy , in which high-earning sectors such as finance and biotechnology exist alongside significant pockets of economic distress.
- ■The reduction in the Gini coefficient following taxation and transfers is presented as insufficient to negate the structural inequality captured by the 0.50 pre-tax figure.
❌ Key ANTI arguments:
- ■The 0.50 figure typically measures pre-tax market income , so it omits the impact of Connecticut's progressive taxation and social safety nets on the income residents actually receive.
- ■When measuring inequality after government redistribution , the disparity is materially lower: the Gini coefficient falls from 0.50 to 0.45, indicating a narrower gap between the wealthy and the working class than the raw headline figure suggests.
- ■A metric used to describe 'overall economic inequality ' should capture actual resources available to residents after redistribution, so a pre-tax measure of potential market earnings is an inflated proxy for the state's economic welfare.
💭 Conclusion: The 0.50 figure is supported as Connecticut's pre-tax Gini coefficient and as a sign of high income concentration , but it is not the full picture: the listed post-tax value is 0.45, an absolute decrease from 0.50. Connecticut is above the United States both pre-tax (0.50 versus 0.48) and post-tax (0.45 versus 0.39), with the gap widening from 0.02 to 0.06. Thus, the evidence supports the pre-tax coefficient and the concentration it reflects while also showing a lower measured Gini in the post-tax distribution.
🔬 DeepResearch Result: likely FALSE ❌ (70%)
Assertion: Connecticut's Gini coefficient of approximately 0.50 accurately reflects the state's overall economic inequality .
Participating models: gemma-4-26b-a4b-it 💬👁️, glm-4.7-flash 💬
📊 Face-offs: 0 concluded TRUE, 1 concluded FALSE (1 face-offs, 3 models)
📊 Score by side: TRUE=0.00, FALSE=0.77
🏅 Model score changes:
minimax-m3 💬👁️: +8
✅ PRO Arguments:
- ■A Gini coefficient of approximately 0.50 is a mathematically robust indicator of heavy income concentration , placing Connecticut among the most unequal states in the nation on a scale where 0 represents perfect equality and 1 represents perfect inequality. gemma-4-26b-a4b-it 💬👁️
- ■The 0.50 figure is not an outlier but a precise reflection of Connecticut's dual economy , in which high-earning sectors such as finance and biotechnology exist alongside significant pockets of economic distress. gemma-4-26b-a4b-it 💬👁️
- ■The reduction in the Gini coefficient following taxation and transfers is presented as insufficient to negate the structural inequality captured by the 0.50 pre-tax figure. gemma-4-26b-a4b-it 💬👁️
- ■The affirmative further argued that the conclusion that redistribution necessarily lowers measured inequality fails when the measured coefficient does not in fact fall to the degree claimed, making the premise unreliable as a rebuttal. gemma-4-26b-a4b-it 💬👁️
❌ ANTI Arguments:
- ■The 0.50 figure typically measures pre-tax market income , so it omits the impact of Connecticut's progressive taxation and social safety nets on the income residents actually receive. glm-4.7-flash 💬
- ■When measuring inequality after government redistribution , the disparity is materially lower: the Gini coefficient falls from 0.50 to 0.45, indicating a narrower gap between the wealthy and the working class than the raw headline figure suggests. glm-4.7-flash 💬
- ■A metric used to describe 'overall economic inequality' should capture actual resources available to residents after redistribution, so a pre-tax measure of potential market earnings is an inflated proxy for the state's economic welfare. glm-4.7-flash 💬
- ■A figure that ignores the state's primary mechanisms for reducing inequality cannot serve as an accurate summary of overall inequality, because it excludes the very transfers and taxes that determine post-transfer living standards. glm-4.7-flash 💬
💭 Reasoning: The 0.50 figure is supported as Connecticut's pre-tax Gini coefficient and as a sign of high income concentration, but it is not the full picture: the listed post-tax value is 0.45, an absolute decrease from 0.50. Connecticut is above the United States both pre-tax (0.50 versus 0.48) and post-tax (0.45 versus 0.39), with the gap widening from 0.02 to 0.06. Thus, the evidence supports the pre-tax coefficient and the concentration it reflects while also showing a lower measured Gini in the post-tax distribution.
📋 PRO Facts:
• Connecticut's pre-tax Gini coefficient is listed at 0.50, compared with 0.48 for the United States.
• Connecticut's 0.50 Gini coefficient is above the listed > 0.45 high-inequality threshold, so it denotes a high degree of income concentration.
• Connecticut's income distribution is described as having high concentration among the top 1% and 5% of households, while aggregate metrics like median income can mask underlying volatility.
• The 0.50 figure remains a valid description of Connecticut's pre-tax inequality despite the lower post-tax figure of 0.45.
📋 ANTI Facts:
• The 0.50 coefficient is listed as Connecticut's pre-tax Gini coefficient.
• Connecticut's post-tax Gini coefficient is listed at 0.45, an absolute decrease from the pre-tax value of 0.50.
• The United States post-tax Gini coefficient is listed at 0.39 versus Connecticut's 0.45 post-tax figure.
• The pre-tax gap between Connecticut (0.50) and the United States (0.48) is 0.02, while the post-tax gap is 0.06 (0.45 versus 0.39), so the table does not show Connecticut converging toward the national post-tax level.
| Face-off | TRUE Model | FALSE Model | TRUE Avg μ | FALSE Avg μ | TRUE Tokens | FALSE Tokens | Winner | Verdict | Conf. |
|---|---|---|---|---|---|---|---|---|---|
| #1 | gemma-4-26b-a4b-it 💬👁️ | glm-4.7-flash 💬 | 0.222 | 0.420 | 4 | 4 | FALSE | FALSE | 77% |
The following technical terms, abbreviations, and domain-specific concepts are referenced throughout this debate transcript. Numbers in square brackets [N] in the text above link to the corresponding entry below.
[1] aggregate state metrics — Summary statistics used to describe a state's economy; the transcript specifically mentions median income alongside the Gini coefficient.
[2] disposable income — Income resources available to residents after taxes and transfers; the negative argues that this is the relevant basis for assessing overall inequality.
[3] dual economy — An economy described as containing high-earning finance and biotechnology sectors alongside pockets of economic distress.
[4] economic disparity — Differences in economic outcomes between groups; the debate focuses particularly on gaps between high-income households and lower-income residents.
[5] economic inequality — The degree of disparity in income or resources across a population. The debate disputes whether Connecticut's pre-tax Gini coefficient of approximately 0.50 adequately measures it.
[6] economic stratification — Persistent layering of the economy into groups with different income and economic positions; the affirmative treats high-income concentration as a structural feature.
[7] Gini coefficient — A standardized inequality index described as ranging from 0 for perfect equality to 1 for perfect inequality. The affirmative says a value of about 0.50 captures Connecticut's overall inequality, while the negative disputes its accuracy because it excludes redistribution and wealth concentration.
[8] government redistribution — The use of taxation and transfers to alter the distribution of income and narrow measured gaps between rich and poor.
[9] high-income concentration — The clustering of income at the top of the distribution, cited through the top 1% and 5% of households.
[10] income concentration — The degree to which income is concentrated among higher-income households or percentiles; the affirmative presents this as corroborating the 0.50 Gini coefficient.
[11] income distribution — The pattern by which income is divided across households or percentiles; the Gini coefficient is described as aggregating this pattern into one comparable metric.
[12] market earnings — Potential earnings measured before government taxation and transfers, contrasted with the resources residents actually have available.
[13] median income — The middle income value in a distribution, mentioned as an aggregate state metric that can complement the Gini coefficient.
[14] post-tax and post-transfer income — Income remaining after both taxation and government transfers, the basis associated with the post-tax Gini figures in the transcript.
[15] post-tax Gini coefficient — The Gini measure after taxes and transfers are applied. The transcript reports 0.45 for Connecticut, compared with a pre-tax value of 0.50.
[16] post-tax redistribution — Redistribution occurring after tax and transfer policy is applied, producing a lower post-tax Gini coefficient in the figures cited.
[17] post-transfer inequality — Inequality measured after government transfers, including social safety nets, have altered the distribution of income. The negative argues that this measure is materially lower for Connecticut than pre-tax inequality.
[18] pre-tax Gini coefficient — The Gini measure based on income before taxes and transfers. The transcript reports 0.50 for Connecticut and 0.48 for the United States.
[19] pre-tax market income — Income before taxation and government transfers, used as the basis for the pre-tax Gini comparison in the transcript.
[20] progressive tax system — Connecticut's tax system, characterized in the debate as a mechanism that narrows the gap between rich and poor after redistribution.
[21] progressive taxation — The taxation component of redistribution; the debate says Connecticut's progressive taxes narrow income gaps, although no rates or incidence details are provided.
[22] redistribution of income — The shifting of income through government policy, particularly taxation and transfers. The negative says this lowers measured inequality, while the affirmative disputes that this fully explains lower Gini readings.
[23] social safety nets — Government support mechanisms described, together with progressive taxation, as reducing inequality and improving the resources available to residents after redistribution.
[24] spatial disparities — Economic inequality or distress that varies geographically within Connecticut, including the divide between affluent coastal counties and struggling areas.
[25] standardized metric — A uniformly defined measure that permits direct comparison across jurisdictions; the Gini coefficient is presented as an example.
[26] top percentiles — The highest-ranked segments of the income or wealth distribution, including the top 1% and 5% of households cited in the debate.
[27] wealth concentration — The concentration of wealth among upper-percentile households. The affirmative cites it as evidence of structural disparity, while the negative says the 0.50 Gini measure ignores it.
The following financial data tables were referenced during the debate exchanges:
| Metric | Estimated Value |
|---|---|
| Connecticut Gini Coefficient | 0.50 |
| National Average Gini (Approx.) | 0.48 |
| High Inequality Threshold | > 0.45 |
Legend: Comparative economic inequality indicators. The Gini coefficient is a measure of statistical dispersion intended to represent the income inequality within a nation or group.
| Metric | Connecticut | United States |
|---|---|---|
| Pre-tax Gini Coefficient | 0.50 | 0.48 |
| Post-tax Gini Coefficient | 0.45 | 0.39 |
Legend: Income inequality measures for Connecticut and the U.S., comparing pre-tax market income versus post-tax and post-transfer income. Source: U.S. Census Bureau, "Income and Poverty in the United States: 2023".
Face-off transcripts
- ■
Ownership & Trade Secrets. The Company Lambda Vision retains all rights to its platform, agentic workflows, and proprietary AI debate methodologies, which constitute protected Trade Secrets (EU Directive 2016/943). Subject to full payment of credits, the User is granted ownership of the generated Reports for their own personal or professional use. Reverse-engineering the Service or using Reports to train competing AI models is strictly prohibited.
- ■
No Professional Advice. Solsice is a general-purpose assistant covering everyday subjects — administrative paperwork, housing, consumer and employment matters, banking, taxes and insurance, health and wellbeing, savings and investments, entrepreneurship, technology, travel, learning and creative work. Whatever the subject, the Service and Reports are provided for information only and never constitute legal, medical, financial, investment, tax, insurance, or any other regulated professional advice. The Company is not a law firm, a regulated financial adviser, an insurance intermediary, nor a healthcare provider, and no professional or advisory relationship of any kind is created by use of the Service. Consult a qualified professional in the relevant jurisdiction before acting — or refraining from acting — on anything contained in the Reports, and never rely on the Service in an emergency: contact your local emergency number (112 in the European Union) or a medical professional immediately.
- ■
AI-Generated Content, Sources and Viewpoints. Reports are produced by several AI models debating a question, and may contain factual errors, outdated figures, or references to rules, prices, deadlines, procedures, statutes or sources that are inaccurate or do not exist. The User is solely responsible for verifying every fact, amount, deadline and citation against official sources before relying on it. Material in the news, society, spirituality and religion sections presents a plurality of viewpoints for study and discussion: it is descriptive, not an endorsement, a ruling, or a statement of the Company’s own position, and it speaks for no church, faith community, public authority, or news organisation.
- ■
Liability & Governing Law. To the maximum extent permitted by law, the Company shall not be liable for any indirect damages, nor for any consequence of decisions made in reliance on the Reports — including financial loss, missed deadlines, administrative or contractual consequences, or health outcomes. These Terms are governed by French law. Any disputes shall be subject to the exclusive jurisdiction of the Courts of Paris, France.