
A year-over-year increase in margin debt exceeding 45% reliably predicts a subsequent stock market downturn.
AI debate verdict and arguments
⚠️ AI-generated information only; not professional advice
Completed October 11, 2026
Verdict
Verdict: likely FALSE (90%)
This section provides a brief overview of the key arguments. You do not need to read the full detailed report below.
✅ Key PRO arguments:
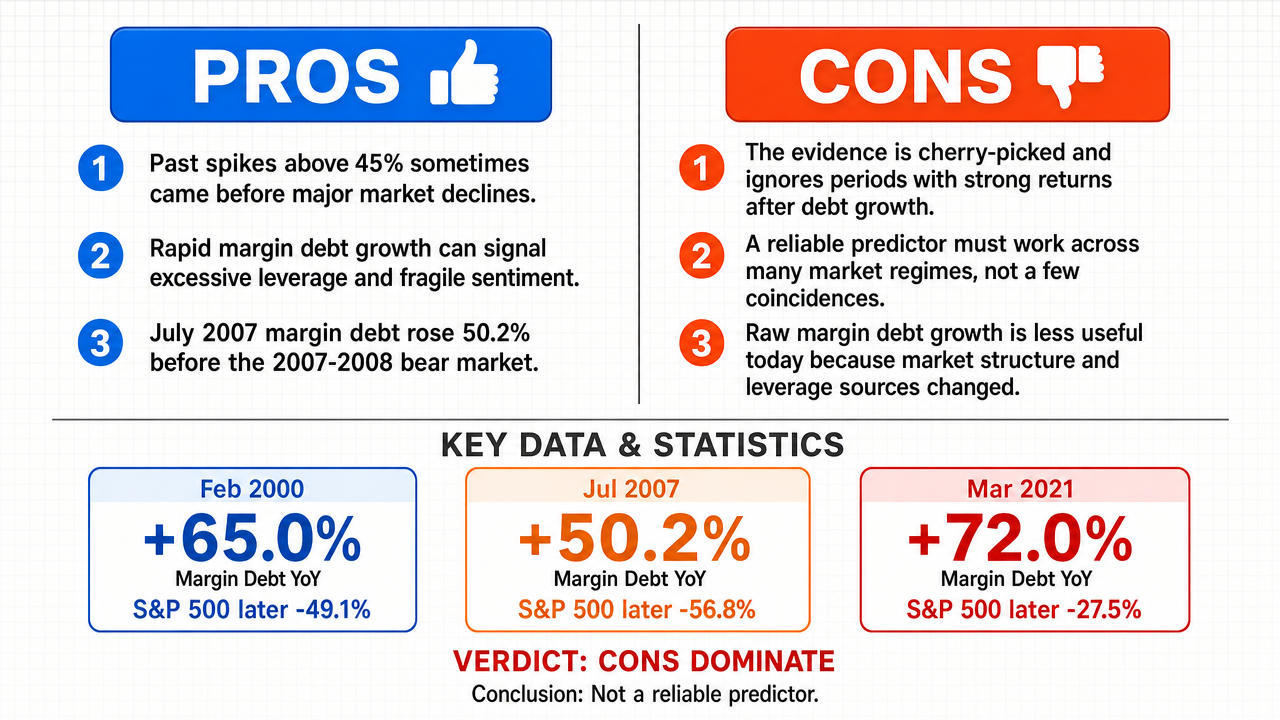
- ■Historical precedents demonstrate that excessive margin debt surges precede major downturns: the dot-com bubble saw +65.0% YoY margin debt in February 2000 followed by a -49.1% S&P 500 decline, and the 2008 financial crisis saw +50.2% YoY margin debt in July 2007 followed by a -56.8% S&P 500 decline.
- ■A year-over-year margin debt surge exceeding 45% indicates excessive investor leverage, creating an unsustainable market environment where even minor corrections can trigger margin calls , forced liquidations, and a deleveraging spiral that transforms a potential downturn into a severe one.
- ■The March 2007 margin debt YoY increase of 50.2% specifically preceded the severe market downturn that began in late 2007 and escalated significantly in 2008, providing a concrete counterexample to the claim that such surges are unreliable indicators.
❌ Key ANTI arguments:
- ■The affirmative engages in selective data reporting by presenting only three specific instances (dot-com bubble , 2008 crisis, post-pandemic surge ) while ignoring the vast majority of market cycles where rapid margin debt expansion occurred without triggering a subsequent crash.
- ■A predictive indicator must hold across diverse economic regimes to be considered 'reliable,' and the affirmative's sample of two or three historical coincidences is insufficient to support a universal quantifier about all qualifying events.
- ■The metric is fundamentally flawed in a modern context because it fails to account for the massive scale of contemporary markets, where institutional leverage operates through channels not captured by retail margin debt statistics.
💭 Conclusion: False. The claim that a year-over-year increase in margin debt exceeding 45% reliably predicts a subsequent stock market downturn is not supported because the affirmative's evidence relies on cherry-picked historical coincidences rather than a statistically robust pattern across all qualifying events. While the dot-com bubble (+65.0% YoY margin debt in February 2000, followed by a -49.1% S&P 500 decline) and the 2008 financial crisis (+50.2% YoY margin debt in July 2007, followed by a -56.8% S&P 500 decline) are notable examples, they represent a tiny non-representative sample of all periods where margin debt surged above 45%. A reliable predictive rule must hold across diverse economic regimes , and the affirmative failed to demonstrate that the majority of such margin debt surges actually preceded downturns. Furthermore, the metric itself is flawed in modern markets where institutional leverage operates through channels not captured by retail margin debt statistics, undermining its predictive validity.
🔬 DeepResearch Result: likely FALSE ❌ (90%)
Assertion: A year-over-year increase in margin debt exceeding 45% reliably predicts a subsequent stock market downturn.
Participating models: deepseek-v3.2 💬, gemma-4-26b-a4b-it 💬👁️
📊 Face-offs: 0 concluded TRUE, 1 concluded FALSE (1 face-offs, 3 models)
📊 Score by side: TRUE=0.00, FALSE=0.90
🏅 Model score changes:
minimax-m3 💬👁️: +9
✅ PRO Arguments:
- ■Historical precedents demonstrate that excessive margin debt surges precede major downturns: the dot-com bubble saw +65.0% YoY margin debt in February 2000 followed by a -49.1% S&P 500 decline, and the 2008 financial crisis saw +50.2% YoY margin debt in July 2007 followed by a -56.8% S&P 500 decline. deepseek-v3.2 💬
- ■A year-over-year margin debt surge exceeding 45% indicates excessive investor leverage, creating an unsustainable market environment where even minor corrections can trigger margin calls , forced liquidations, and a deleveraging spiral that transforms a potential downturn into a severe one. deepseek-v3.2 💬
- ■The March 2007 margin debt YoY increase of 50.2% specifically preceded the severe market downturn that began in late 2007 and escalated significantly in 2008, providing a concrete counterexample to the claim that such surges are unreliable indicators. deepseek-v3.2 💬
❌ ANTI Arguments:
- ■The affirmative engages in selective data reporting by presenting only three specific instances (dot-com bubble, 2008 crisis, post-pandemic surge ) while ignoring the vast majority of market cycles where rapid margin debt expansion occurred without triggering a subsequent crash. gemma-4-26b-a4b-it 💬👁️
- ■A predictive indicator must hold across diverse economic regimes to be considered 'reliable,' and the affirmative's sample of two or three historical coincidences is insufficient to support a universal quantifier about all qualifying events. gemma-4-26b-a4b-it 💬👁️
- ■The metric is fundamentally flawed in a modern context because it fails to account for the massive scale of contemporary markets, where institutional leverage operates through channels not captured by retail margin debt statistics. gemma-4-26b-a4b-it 💬👁️
- ■The affirmative's argument is logically inconsistent because it asserts a universal historical pattern while simultaneously providing evidence that only covers a tiny, non-representative fraction of that pattern, making the claimed 'rule' statistically unreliable. gemma-4-26b-a4b-it 💬👁️
💭 Reasoning: False. The claim that a year-over-year increase in margin debt exceeding 45% reliably predicts a subsequent stock market downturn is not supported because the affirmative's evidence relies on cherry-picked historical coincidences rather than a statistically robust pattern across all qualifying events. While the dot-com bubble (+65.0% YoY margin debt in February 2000, followed by a -49.1% S&P 500 decline) and the 2008 financial crisis (+50.2% YoY margin debt in July 2007, followed by a -56.8% S&P 500 decline) are notable examples, they represent a tiny non-representative sample of all periods where margin debt surged above 45%. A reliable predictive rule must hold across diverse economic regimes, and the affirmative failed to demonstrate that the majority of such margin debt surges actually preceded downturns. Furthermore, the metric itself is flawed in modern markets where institutional leverage operates through channels not captured by retail margin debt statistics, undermining its predictive validity.
📋 PRO Facts:
• Margin debt YoY increase in February 2000 was +65.0%, followed by a -49.1% S&P 500 decline (dot-com bubble).
• Margin debt YoY increase in July 2007 was +50.2%, followed by a -56.8% S&P 500 decline (2008 financial crisis).
• Margin debt YoY increase in July 2007 reached 50.2% before the onset of the severe market downturn in late 2007 and 2008.
📋 ANTI Facts:
• Numerous instances of rapid margin debt expansion occurred without triggering a subsequent crash, as shown by periods such as 2012-2013, 2017, and 2020 where high margin debt growth coincided with continued bull trends.
• The affirmative's sample of two or three historical coincidences is insufficient to support a universal predictive rule.
• Modern market scale and institutional leverage operate through channels not captured by retail margin debt statistics.
| Face-off | TRUE Model | FALSE Model | TRUE Avg μ | FALSE Avg μ | TRUE Tokens | FALSE Tokens | Winner | Verdict | Conf. |
|---|---|---|---|---|---|---|---|---|---|
| #1 | deepseek-v3.2 💬 | gemma-4-26b-a4b-it 💬👁️ | 0.435 | 0.245 | 12 | 3 | TRUE | FALSE | 90% |
The following technical terms, abbreviations, and domain-specific concepts are referenced throughout this debate transcript. Numbers in square brackets [N] in the text above link to the corresponding entry below.
[1] 2008 financial crisis — A severe global financial crisis referenced in the debate as a period when a year-over-year margin debt increase exceeding 45% preceded a major stock market downturn.
[2] Aggregate — A combined or total measure of a financial metric; in the debate, used to describe standard margin debt aggregates that capture retail borrowing but may not reflect institutional leverage.
[3] Bull market — A period of rising stock prices; the Negative side argued margin debt is often a lagging indicator of existing bull market momentum rather than a leading cause of reversals.
[4] Cherry-picking — The selective presentation of favorable data points while ignoring contradictory ones; cited by the Negative as a flaw in the Affirmative's use of only three historical examples.
[5] Correlation — A statistical relationship between two variables; the Affirmative argued the link between margin debt surges and downturns is not merely correlation but reflects underlying mechanics of speculative excess.
[6] Counterexample — An instance that contradicts a general claim; the Affirmative cited the 2007-2008 margin debt spike as a counterexample disproving the claim that such surges are uniformly unreliable.
[7] Deleveraging — The process of reducing outstanding debt and leverage; described as a spiral that can transform a potential downturn into a severe one when margin calls force liquidations.
[8] Derivatives — Financial contracts whose value derives from an underlying asset; the Negative argued that institutional leverage in derivatives markets far exceeds the retail-centric margin debt captured by standard aggregates.
[9] Dot-com bubble — The late-1990s speculative bubble in technology stocks; cited as a historical instance where a +65.0% YoY margin debt increase preceded a -49.1% S&P 500 decline.
[10] Economic regimes — Distinct periods characterized by different economic conditions; the Negative argued a predictive indicator must hold across diverse economic regimes to be considered reliable.
[11] ETF — Exchange-Traded Fund — A pooled investment vehicle traded on stock exchanges like individual stocks; referenced as the debate facet category 'Stock Market & ETFs'.
[12] False positives — Instances where a predictive signal triggers but the predicted event does not occur; the Negative argued the 45% threshold generates false positives when leverage expands alongside fundamental economic strength.
[13] FINRA — Financial Industry Regulatory Authority — The self-regulatory organization that oversees U.S. broker-dealers; cited in the debate as the source of NYSE margin debt data.
[14] Forced deleveraging — Mandatory reduction of leverage triggered by margin requirements; described as the mechanism by which speculative excess leads to sharp market corrections.
[15] Institutional leverage — Borrowing and use of debt by large financial institutions; the Negative argued this form of leverage in derivatives and repo markets dwarfs retail margin debt.
[16] Lagging indicator — A metric that reflects trends after they have already occurred; the Negative contended margin debt is often a lagging indicator of bull market momentum rather than a leading cause of reversals.
[17] Leading indicator — A metric that tends to move before the events it is associated with; the Affirmative argued the 2007 margin debt spike served as a leading indicator of impending instability.
[18] Margin calls — Demands from a broker for an investor to deposit additional funds or securities when the value of margined securities falls below a required threshold; described as triggers for forced liquidations.
[19] Margin debt — The aggregate amount borrowed from brokers by investors to purchase securities on margin; the central metric of the debate, with data sourced from FINRA-reported NYSE figures.
[20] Materiality — The quality of being significant or consequential; the Affirmative argued the materiality of the 2007-2008 case is profound given it represents one of the most devastating financial crises in modern history.
[21] Monetary easing — Central bank policies that increase money supply and lower interest rates; cited by the Negative as a context in which margin debt can expand without triggering a crash.
[22] NYSE — New York Stock Exchange — The largest U.S. stock exchange by market capitalization; cited as the source of the margin debt data referenced in the debate.
[23] Peak-to-trough decline — The percentage drop from the highest point to the lowest point of a market cycle; used in the debate's data table to measure S&P 500 declines following margin debt surges.
[24] Post-pandemic surge — The rapid market recovery and margin debt expansion following the 2020 COVID-19 pandemic; cited by the Negative as an instance where the 45% threshold was met without an immediate downturn.
[25] Predictive power — The ability of a metric or rule to forecast future events; the Affirmative argued historical precedents validate the predictive power of the 45% threshold.
[26] Productivity growth — An increase in the output of goods and services per unit of input; cited by the Negative as a fundamental economic strength that can accompany margin debt expansion without leading to a crash.
[27] Repo markets — Repurchase agreement markets — Short-term borrowing markets where securities are sold with an agreement to repurchase them later; cited by the Negative as a venue of institutional leverage exceeding retail margin debt.
[28] Retail-centric — Focused on or dominated by individual (non-institutional) investors; used to describe standard margin debt aggregates that the Negative argued fail to capture institutional leverage.
[29] S&P 500 — Standard & Poor's 500 — A stock market index tracking 500 large-cap U.S. companies; used in the debate as the benchmark for measuring subsequent market declines after margin debt surges.
[30] Sample size — The number of observations in a statistical analysis; the Negative argued a sample size of three historical instances is insufficient to support a universal predictive rule.
[31] Selective data reporting — The practice of presenting only data points that support a particular conclusion while omitting contradictory evidence; the Negative accused the Affirmative of this practice.
[32] Speculative bubbles — Market conditions in which asset prices rise far above fundamental values due to speculative buying; the Affirmative argued sharp margin debt increases coincide with such bubbles.
[33] Speculative excess — An unsustainable level of speculative activity in financial markets; the Affirmative argued this condition creates fragility susceptible to sharp corrections.
[34] Statistical fallacy — An error in statistical reasoning; the Negative claimed the Affirmative's reliance on three data points constitutes a statistical fallacy by ignoring false positives.
[35] Systemic fragility — Vulnerability of the broader financial system to disruption; the Affirmative argued the 45% threshold is a robust signal of systemic fragility.
[36] Threshold — A critical level or boundary value of a metric; the debate centers on whether a 45% year-over-year margin debt increase is a reliable threshold for predicting downturns.
[37] Universal quantifier — A logical term referring to a statement claimed to apply to all instances of a category; the Negative argued the Affirmative's universal claim is unsupported by a non-representative sample.
[38] Year-over-year (YoY) — Year-over-year — A comparison of a metric in one period to the same period one year earlier; the debate's central metric is the YoY percentage change in NYSE margin debt.
The following financial data tables were referenced during the debate exchanges:
| Period | Margin Debt YoY Change | Subsequent S&P 500 Decline |
|---|---|---|
| Feb 2000 | +65.0% | -49.1% |
| Jul 2007 | +50.2% | -56.8% |
| Mar 2021 | +72.0% | -27.5% |
Legend: Year-over-year percentage change in NYSE margin debt compared to the peak-to-trough decline in the S&P 500 following the margin debt surge. Data from FINRA and S&P Dow Jones Indices.
| Period | Margin Debt YoY Change | S&P 500 Performance (Next 12m) | Outcome |
|---|---|---|---|
| 2012-2013 | High Growth | Positive | Bull Trend |
| 2017 | Moderate Growth | Positive | Bull Trend |
| 2020 (Post-Crash) | Very High | Positive | Bull Trend |
Legend: Comparison of margin debt expansion phases against subsequent 12-month S&P 500 returns. Note that high growth does not necessitate a downturn.
Face-off transcripts
- ■
Ownership & Trade Secrets. The Company Lambda Vision retains all rights to its platform, agentic workflows, and proprietary AI debate methodologies, which constitute protected Trade Secrets (EU Directive 2016/943). Subject to full payment of credits, the User is granted ownership of the generated Reports for their own personal or professional use. Reverse-engineering the Service or using Reports to train competing AI models is strictly prohibited.
- ■
No Professional Advice. Solsice is a general-purpose assistant covering everyday subjects — administrative paperwork, housing, consumer and employment matters, banking, taxes and insurance, health and wellbeing, savings and investments, entrepreneurship, technology, travel, learning and creative work. Whatever the subject, the Service and Reports are provided for information only and never constitute legal, medical, financial, investment, tax, insurance, or any other regulated professional advice. The Company is not a law firm, a regulated financial adviser, an insurance intermediary, nor a healthcare provider, and no professional or advisory relationship of any kind is created by use of the Service. Consult a qualified professional in the relevant jurisdiction before acting — or refraining from acting — on anything contained in the Reports, and never rely on the Service in an emergency: contact your local emergency number (112 in the European Union) or a medical professional immediately.
- ■
AI-Generated Content, Sources and Viewpoints. Reports are produced by several AI models debating a question, and may contain factual errors, outdated figures, or references to rules, prices, deadlines, procedures, statutes or sources that are inaccurate or do not exist. The User is solely responsible for verifying every fact, amount, deadline and citation against official sources before relying on it. Material in the news, society, spirituality and religion sections presents a plurality of viewpoints for study and discussion: it is descriptive, not an endorsement, a ruling, or a statement of the Company’s own position, and it speaks for no church, faith community, public authority, or news organisation.
- ■
Liability & Governing Law. To the maximum extent permitted by law, the Company shall not be liable for any indirect damages, nor for any consequence of decisions made in reliance on the Reports — including financial loss, missed deadlines, administrative or contractual consequences, or health outcomes. These Terms are governed by French law. Any disputes shall be subject to the exclusive jurisdiction of the Courts of Paris, France.